
SAT Score Range: Sectional Score Range, Percentile, Score for Top Colleges


Content Curator | Updated On - Apr 1, 2024
SAT score range is the indicator that helps to determine at what level of the test you stand on, depending upon your preparation for SAT examination. Good SAT score range is subjective, depending on which colleges you are applying to. However, earning a good SAT score will help you to stand out to the college admission officers and can increase your chances of getting a college scholarship. SAT score range comprised of these two sections is counted as the total score, which is from 400 to 1600 points. SAT test score range is different for different universities.
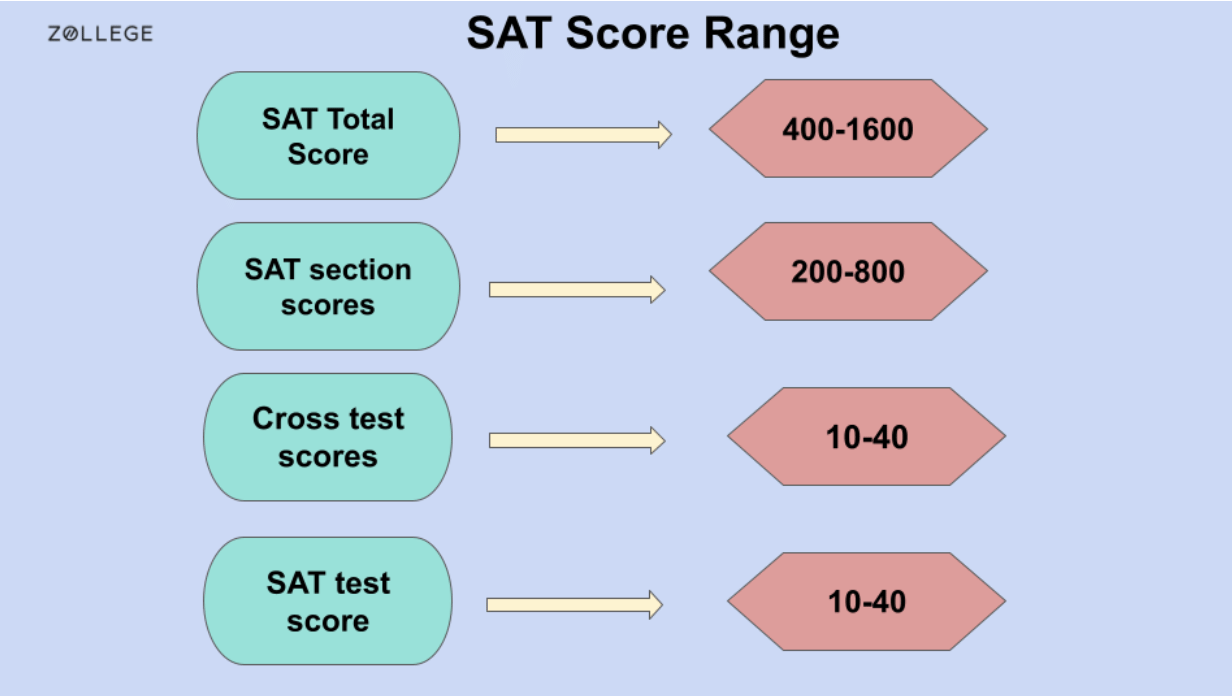
The Scholastic Aptitude Test (SAT) is a standardized test that measures your skills at the college level and is considered as the Benchmark for all the colleges in the US. Understanding SAT sectional score range is very necessary for you to navigate your admissions process. The exam consists of two sections: SAT Evidence-based Reading and Writing and Math. Each of the sections is scored, ranging from 200 to 800 points.
SAT score range for top colleges have strict admission criteria and the scores play a significant role in the selection process. For instance, you need to have SAT score range between 1500-1570 to get into Stanford University SAT scores. SAT score range for Ivy League colleges is mostly between 1470–1570. SAT score range for premium colleges is set towards a higher side as they select the best students from all over the world. SAT good score range is considered between 1300-1500. SAT score range percentile indicates how your performance compares to that of other test takers.
SAT Score Range Overview
The Scaled Score ranges from 200-800 points per section, contributing to a cumulative grade of 1600. SAT Score Range is an important factor for students who are planning to take the exam. However, the scaled score may vary depending on the exam date, as the variety and difficulty level of questions may change.
Knowing SAT Score Range is crucial for several reasons:
- SAT Score Range: SAT Score Range is between 800-1600, which is used to determine a candidate's eligibility for college admission. The average SAT score is 1051, but many students score either higher or lower than this figure.
- Higher Scores mean higher probability of admission: The higher a student scores on SAT, the better their chances of getting accepted into a reputed college or university. A high SAT score is often seen as a reflection of a student's academic ability, potential, and readiness for college-level coursework.
- Percentile Ranking: Percentile Ranking is another important factor that helps to define a student's performance on SAT exam. Percentile ranking compares a student's performance to that of other test-takers. For example, if a student scores in the 90th percentile, it means they scored better than 90% of the other test-takers.
SAT Score Range Section Wise
The below table shows section-wise split of SAT scores and what these numbers mean-
| Maths | SAT Math section is scored out of 800, in 10 point increments. The minimum SAT score is 200, which makes for a range of 200-800. |
|---|---|
| Reading and Writing Section | This SAT EBRW section can be a little tricky to understand. SAT scoring starts off at 10, with 40 being the highest. Therefore, SAT reading score ranges from 10-40. Including one-point increments. Using an Individualized Equating Process, the scale here is again similar to the one for the Mathematics section, 200-800. |
| Optional Essay | SAT Essay scoring components consist of- Reading, Writing, and Analysis. SAT range for the optional essay in the three different sub-sectional scoring components is 2-8. You are scored across the 3 different areas with a maximum SAT score of 8 in each section. |
SAT Score Range ACT Conversion
SAT vs ACT conversion is needed for you if you want to sit for both exams. While SAT syllabus is considered more of an academic aptitude test, ACT is intended as a placement test determining your high school concepts. Students now tend to take both exams. It facilitates score comparison for scholarship eligibility. Below is a table for the score comparison of both the exams:
| SAT | ACT | SAT | ACT | SAT | ACT |
|---|---|---|---|---|---|
| 1600 | 36 | 1260 | 27 | 920 | 17 |
| 1590 | 36 | 1250 | 26 | 910 | 16 |
| 1580 | 36 | 1240 | 26 | 900 | 16 |
| 1570 | 36 | 1230 | 26 | 890 | 16 |
| 1560 | 35 | 1220 | 25 | 880 | 16 |
| 1550 | 35 | 1210 | 25 | 870 | 15 |
| 1540 | 35 | 1200 | 25 | 860 | 15 |
| 1530 | 35 | 1190 | 24 | 850 | 15 |
| 1520 | 34 | 1180 | 24 | 840 | 15 |
| 1510 | 34 | 1170 | 24 | 830 | 15 |
| 1500 | 34 | 1160 | 24 | 820 | 14 |
| 1490 | 34 | 1150 | 23 | 810 | 14 |
| 1480 | 33 | 1140 | 23 | 800 | 14 |
| 1470 | 33 | 1130 | 23 | 790 | 14 |
| 1460 | 33 | 1120 | 22 | 780 | 14 |
| 1450 | 33 | 1110 | 22 | 770 | 13 |
| 1440 | 32 | 1100 | 22 | 760 | 13 |
| 1430 | 32 | 1090 | 21 | 750 | 13 |
| 1420 | 32 | 1080 | 21 | 740 | 13 |
| 1410 | 31 | 1070 | 21 | 730 | 13 |
| 1400 | 31 | 1060 | 21 | 720 | 12 |
| 1390 | 31 | 1050 | 20 | 710 | 12 |
| 1380 | 30 | 1040 | 20 | 700 | 12 |
| 1370 | 30 | 1030 | 20 | 690 | 12 |
| 1360 | 30 | 1020 | 19 | 680 | 11 |
| 1350 | 29 | 1010 | 19 | 670 | 11 |
| 1340 | 29 | 1000 | 19 | 660 | 11 |
| 1330 | 29 | 990 | 19 | 650 | 11 |
| 1320 | 28 | 980 | 18 | 640 | 10 |
| 1310 | 28 | 970 | 18 | 630 | 10 |
| 1300 | 28 | 960 | 18 | 620 | 10 |
| 1290 | 27 | 950 | 17 | 610 | 9 |
| 1280 | 27 | 940 | 17 | 600 | 9 |
| 1270 | 27 | 930 | 17 | 590 | 9 |
SAT Subscores
SAT score range consists of subscores and cross scores. Colleges need to know about a candidate's specific skill sets. Therefore, SAT provides the subscores and cross-test scores, which indicates exactly that- knowledge about a specific subject. It shows the highest SAT subject test scores individally:
| EBRW Subscores | Expression of ideas |
|---|---|
| Math Subscores | Heart of Algebra Problem Solving and Data Analysis Passport to Advanced Math |
SAT Cross Test Scores
Your SAT score report contains two additional scores called cross-test scores for Analysis in Science and Analysis in History or Social Science. SAT score scale of these two sections is not based only on your performance in one single section, but it evaluates your ability to implement all analytical skills in all three sections - Reading, Writing, Language, and Math.
| SAT Section | Score Range |
|---|---|
| Evidence-Based Reading and Writing (EBRW) | 200-800 |
| Reading | 10-40 |
| Writing and Language | 10-40 |
| Expression of Ideas | 1-15 |
| Standard English Conventions | 1-15 |
| Words in Context | 1-15 |
| Command of Evidence | 1-15 |
| Math | 200-800 |
| Heart of Algebra | 1-15 |
| Problem Solving and Data Analysis | 1-15 |
| Passport to Advanced Math | 1-15 |
| Cross-Test Scores | — |
| Analysis in History/Social Studies | 10-40 |
| Analysis in Science | 10-40 |
| TOTAL (EBRW + Math) | 400-1600 |
| Essay (Scored across 3 areas) | |
| Reading | 2-8 |
| Analysis | 2-8 |
| Writing | 2-8 |
SAT Score Chart
SAT test scoring chart is a table that displays the total test score range a student can achieve on the exam. SAT score range table is divided into two sections: SAT math section and the reading and writing section. SAT score range for math is 800. The maximum score on SAT reading and writing section is also 800. Therefore, the total maximum score a student can achieve on SAT score conversion chart is 1600.
SAT Cumulative Score for 2023 was 1023. A good SAT score for the Evidence Reading and Writing section was 520 and for the mathematics is 510. The updated SAT score for 2024 hasn't come yet, but it is said that SAT score range for 2024 will be around 1023 too.
| SAT Components | Description | Score Range |
|---|---|---|
| Total Score | The aggregate of the two section scores | 400–1600 |
| Section Scores | Reading & Writing and Math Sections | 200–800 |
| Test Scores | Reading, Writing and Language, and Math Sections. | 10–40 |
| Cross-Test | These scores show how well you use your skills to analyze texts and solve problems in these subject areas. | 10–40 |
| SAT Sub Scores | Reading and Writing and Language: Command of Evidence and Words in Context & Expression of Ideas and Standard English Conventions. Math: Heart of Algebra, Problem Solving and Data Analysis, and Passport to Advanced Math. | 200-200 |
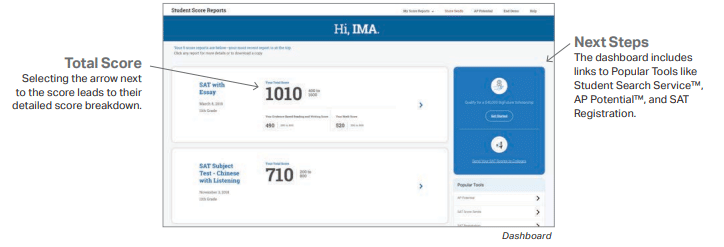
The test-takers can check their scores. Here is SAT score report PDFs of the candidates. Like in the below image it can be seen that SAT total score of the candidate can be seen along with the potential in their dashboard.
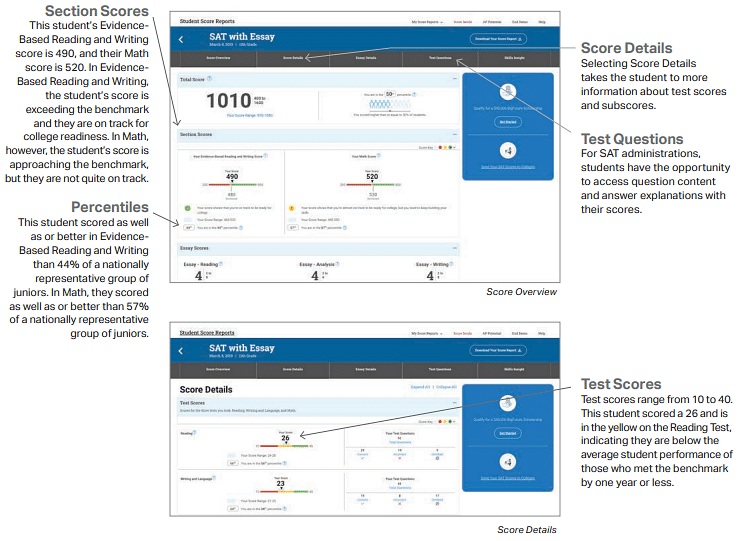
The next image shows scores for individual sections like SAT EBRW and Percentiles scores. The test scores ranges from 10-40 and the stdent must secure an avergae score to get admission in the desired university.
SAT Score Distribution
Calculating SAT reading and EBRW, SAT's median score is 1000. Statistically, the majority of test-takers' scores are moving in a bell curve direction. The score is not necessarily exactly 1000 in every case. This shows that if any candidate receives a score of about 1500, he/she is among the top 1% of applicants who took SAT.
SAT Score Range and Percentile
SAT score range and percentile can be calculated differently for each sections. Here is a table of how the average SAT Score range percentile is calculated, for better understanding:
| Percentile | EBRW | Math | TOTAL |
|---|---|---|---|
| 99 | 750-800 | 770-800 | 1480-1600 |
| 90 | 670 | 680 | 1320-1330 |
| 75 | 610 | 600 | 1200 |
| 50 | 530 | 520 | 1060 |
| 25 | 460 | 450 | 920 |
| 10 | 400 | 390 | 810 |
| 1 | 200-330 | 200-320 | 400-680 |
SAT Conversion Chart
SAT conversion chart is used to convert a student's raw score (the number of questions they answered correctly) into a scaled score. The scaled score for average SAT score range is a number between 200 and 800 and is used to compare a student's performance on SAT test to other students. SAT conversion chart varies from test to test because the difficulty of each test may vary. Therefore, SAT score calculator chart is adjusted to account for differences in difficulty.
Here is an example of an SAT conversion chart for SAT subject math 2 score chart and Reading and SAT writing score chart:
| Raw Score | Math Scaled Score | Reading and Writing Scaled Score |
|---|---|---|
| 0 | 200 | 200 |
| 1 | 210 | 210 |
| 2 | 230 | 220 |
| 3 | 250 | 230 |
| 4 | 270 | 240 |
| 5 | 290 | 250 |
| 6 | 310 | 260 |
| 7 | 330 | 270 |
| 8 | 350 | 280 |
| 9 | 370 | 290 |
| 10 | 390 | 300 |
| 11 | 410 | 310 |
| 12 | 430 | 320 |
| 13 | 450 | 330 |
| 14 | 470 | 340 |
| 15 | 490 | 350 |
| 16 | 510 | 360 |
| 17 | 530 | 370 |
| 18 | 550 | 380 |
| 19 | 560 | 390 |
| 20 | 580 | 400 |
| 21 | 600 | 410 |
| 22 | 620 | 420 |
| 23 | 630 | 430 |
| 24 | 650 | 440 |
| 25 | 660 | 450 |
SAT Reading Score Chart
SAT reading score chart displays the range of scores a student can achieve on the reading section of the test. SAT reading section consists of 52 multiple-choice questions that assess a student's ability to analyze and interpret written material. The maximum total SAT score range average that a student can achieve on the reading section is 800. Here is a breakdown of SAT reading score chart:
| Raw Score | Scaled Score |
|---|---|
| 0 | 200 |
| 1 | 210 |
| 2 | 220 |
| 3 | 230 |
| 4 | 240 |
| 5 | 250 |
| 6 | 260 |
| 7 | 270 |
| 8 | 280 |
| 9 | 290 |
| 10 | 300 |
| 11 | 310 |
| 12 | 320 |
| 13 | 330 |
| 14 | 340 |
| 15 | 350 |
| 16 | 360 |
| 17 | 370 |
| 18 | 380 |
| 19 | 390 |
| 20 | 400 |
| 21 | 410 |
| 22 | 420 |
| 23 | 430 |
| 24 | 440 |
| 25 | 450 |
| 26 | 460 |
SAT Score Range for Top Colleges
A good SAT score range varies depending upon the colleges that the candidates are applying to. Candidates can get admission in top colleges with a SAT Score range between 1500-1550. Top colleges like MIT SAT score range, and Harvard is tabulated. Here in the below given table is the average SAT score requirement top colleges admission process:
| University/ School | Average SAT Score |
|---|---|
| Massachusetts Institute of Technology | 1500-1570 |
| Stanford University | 1505 |
| Harvard University | 1470 |
| California Institute of Technology | 1545 |
| University of Chicago | 1510-1560 |
| University of Pennsylvania | 1470-1550 |
| Yale University | 1460-1560 |
| Columbia University | 1400+ |
| Princeton University | 1505-1570 |
| Cornell University | 1480 |
| Johns Hopkins University | 1450 |
| Northwestern University | 1490 |
| University of California, Berkeley | 1330-1530 |
| University of California, Los Angeles | 1500 |
| Duke University | 1450 |
| Brown University | 1420 |
| Rice University | 1470-1570 |
| Washington University in St. Louis | 1520 |
| University of Southern California | 1440 |
| Emory University | 1435 |
| Vanderbilt University | 1505 |
| University of Notre Dame | 1475 |
| University of Virginia | 1330-1500 |
| Georgetown University | 1380-1550 |
A good SAT score is essential for getting admission to colleges abroad. It is equally important to showcase your overall character, skills, and interests through other factors such as extracurricular activities, community service, and portfolio. A well-rounded profile can significantly increase your chances of getting accepted into your dream college or university.
FAQs
Que. What is the SAT score range?
Que. How are SAT scores determined?
Que. What is a good SAT score?
Que. What percentile do I need to get into top colleges?
Que. Can I take the SAT again to improve my score?
Ques. What is considered a good score in the SAT Exam?
Ques: What is the score range for the SAT exam?
Ques: How is the total SAT score calculated?
Ques: Is there a passing or failing score on the SAT exam?
Ques: Are there separate scores for the SAT Essay section?
Ques: How are raw scores converted to scaled scores on the SAT exam?
Ques: What does percentile rank mean in the context of SAT scores?
Ques: Can I send my best scores to colleges if I take the SAT multiple times?
Ques: How long is the SAT score valid for college applications?
Ques: Can colleges see all of my SAT scores?
*The article might have information for the previous academic years, please refer the official website of the exam.