
GRE Data Analysis: Data Analysis Syllabus, Question Types, and Sample
- GRE Grammar Preparation
- GRE Coaching In Hyderabad
- GRE Coaching In Kolkata
- GRE Online Coaching
- GRE Classes In Pune
- GRE Coaching In Delhi
- GRE Coaching In Bangalore
- Best GRE Coaching India
- Best Book For GRE Verbal
- GRE Preparation Books
- GRE Study Plan
- GRE Prep
- GRE Preparation Time
- GRE Verbal Tips
- GRE Self Preparation
- GRE AWA Books


Content Curator | Updated On - Jun 6, 2024
Highlights:
Number of Questions: There will be 6 data analysis questions in the form of numeric entry or multiple choice questions.
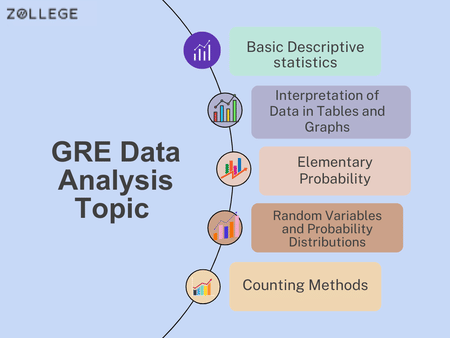
Topics: Basic descriptive statistics, interpretation of data in tables and graphs, elementary probability, random variables and probability distributions, and counting methods
Types of Questions: Pie charts, Bar charts, Line Graphs, Scatter plots and best-fit lines, box plots, histograms, and charts of numerical data.
Score: The total score for GRE quantitative reasoning section is 170 and no fixed marks for the data analysis section.
GRE data analysis is an integral part of quantitative reasoning. You will get 6 questions in the form of multiple-choice questions (both types) or numeric entries. Data analysis in GRE includes questions related to basic descriptive statistics, data interpretation, and elementary probability. Other GRE data analysis questions might include conditional probability, random variables, and counting methods. Data analysis in GRE aims to measure the ability of a candidate to understand, interpret, and analyze quantitative information. The topics are equivalent to introductory statistics and high school-level mathematics. The detailed information related to data interpretation is discussed in the below sections.
Data Interpretation on the GRE Quant
Each Quant segment will conclude with a question on data interpretation. Three questions from GRE Data Interpretation set are based on the same subject and will provide data and facts in a graphical format. So, there will be a total of six DI questions on the test, or more if the experimental part is also a Quant section of the GRE. This is because each GRE Quant section has about three DI questions. Preparing for the GRE Quant requires a significant amount of practice with data interpretation.
Importance of Data Interpretation
Graphs and charts offer an effective approach to communicating a lot of information in an immediately observable way. In comparison to the other GRE quantitaive reasoning questions, the Data Interpretation questions are typically quite simple. Scores for this part of GRE Data Analysis Questions range from 130 to 170, with each point worth 1 point. In examination, data analysis aims to examine your
- Ability to interpreate your analytical information
- Problem-solving, arithmetic, algebra, and geometry may all be accurately measured by all numerical reasoning exercises.
- Ability to track all the information
- Ability to interprete the "complete summary" given at the end of each graph
Importance of GRE Data Analysis
Understanding and interpreting data in a more complex way requires the analysis of GRE data. You can score significantly higher and get into top institutions by passing this data interpretation section. This method allows for the competent resolution of all detailed data and determine the key GRE exam pattern.
- It is not necessary to understand difficult academic arithmetic topics to interpret GRE data. You can succeed in this section of the GRE if you have fundamental abilities and an awareness of how to interpret data.
- On GRE, data interpretation is a powerful verbal substitute for conveying explicit information. The ability to quickly visualise the information is also beneficial. But it is also less prone to mistakes.
- Students should thoroughly study GRE data interpretation because there will be at least 6–8 GRE graph questions. In each quantitative section if they want to score higher than 160 on the quantitative portion.
GRE Data Analysis Exam Pattern
One of the four fundamental ideas of GRE Quantitative Reasoning is data analysis. ability to comprehend information through visualising or interpreting data. You can find statistics, probability graphs, and interpretation graphs in GRE data analysis exercises. There may be multiple-choice or numeric entry questions in this quantitative portion. The math component of each GRE test consists of 20 questions. Only three questions about the interpretation of the data are posed in each area. Hence, there are six data interpretation questions on GRE.
GRE Data Analysis Questions Type
GRE data interpretation questions come in a variety of formats. So, it would be fantastic to study GRE data interpretation in GRE forulas to ensure high GRE scores. On the GRE Data Interpretation, information will be displayed through several visual forms. These include:
- pie charts
- bar charts
- line graphs
- scatterplots & best-fit lines
- box plots
- histograms
- charts of numerical data
Below are the many sorts of data that candidates will see in GRE test's data analysis section.
GRE Data Interpretation - Pie Chart
Here the pie charts are circular charts with sectors, they are frequently referred to as circle graphs. The sectors show proportions or percentages of a quantity that is specified in the question.
SAMPLE:
Browser penetration among internet users in Europe is shown in the pie chart.
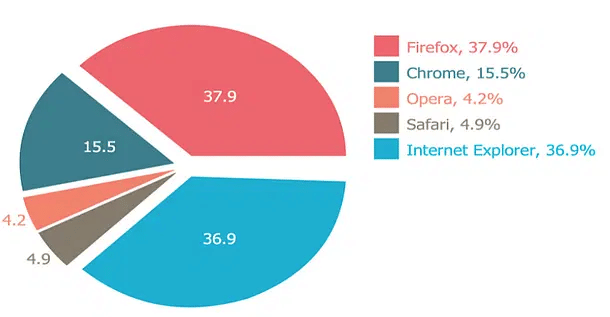
Applicants can utilise this knowledge to respond to any inquiry. For example, suppose the question asks you to determine the proportion of Chrome users given that there are 1 million users overall. Using your understanding of percentages, you can then state that there are 155,000 Chrome users or 15.5% of a million users.
GRE Data Interpretation – Bar Chart
Bar charts are another name for column charts. In a bar chart, rectangular bars with lengths proportionate to the numbers they indicate are used as a type of visual representation. Both a vertical and a horizontal bar plot are possible.
SAMPLE:
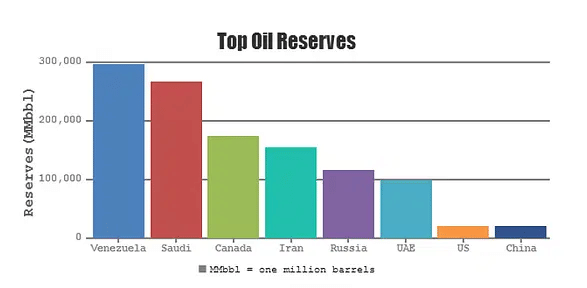
Candidates can use this graph to assess how other nations stack up in terms of their oil reserves. Consider the fact that Iran has 150,000 million barrels of oil and Venezuela has 300 million barrels. Then you can argue that Iran has half as much oil as Venezuela has, or that their respective oil reserves are divided by two, or 2:1. Even questions about percentages, ratios, and proportions might be asked of you.
GRE Data Interpretation – Histograms
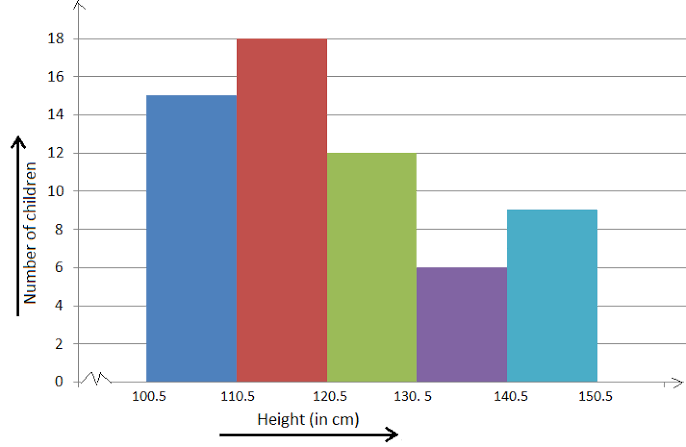
A histogram is very similar to a bar graph but has no spaces between the bars. The main difference is that histograms use continuously grouped data to show frequency trends.
SAMPLE:
GRE Data Interpretation – Double Bar Graphs
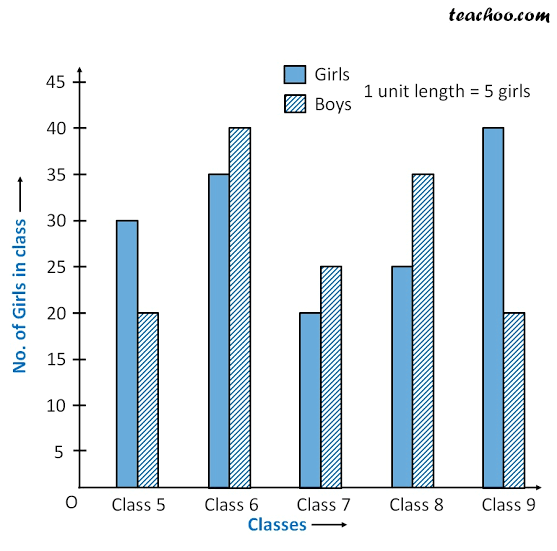
Bar charts can display multiple sets of values for each category.
SAMPLE:
GRE Data Interpretation – Line Chart
To compare the progression of two quantities, line charts are frequently displayed on the television.
Example: The performance of two stocks in the most recent quarter, the GDP growth rates of two countries over time, etc. Line graphs show how quantities change or increase over time.
Here is a line graph illustration.
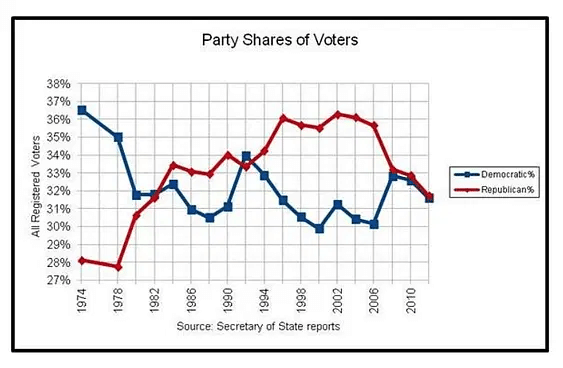
You will be asked questions about these graphs, such as which year witnessed the greatest percentage shift in voter share. for the Democratic party, or the typical percentage of Republican voters between 1980 and 2010. If you can accurately identify the data points from the provided line graphs, you will be able to respond to such questions with ease.
GRE Data Interpretation – Box and Scatter Plots
Compared to the other graph types we've covered so far in this chapter, scatter plots are less common on GRE. Bivariate data can be displayed using scatter plots.
SAMPLE:
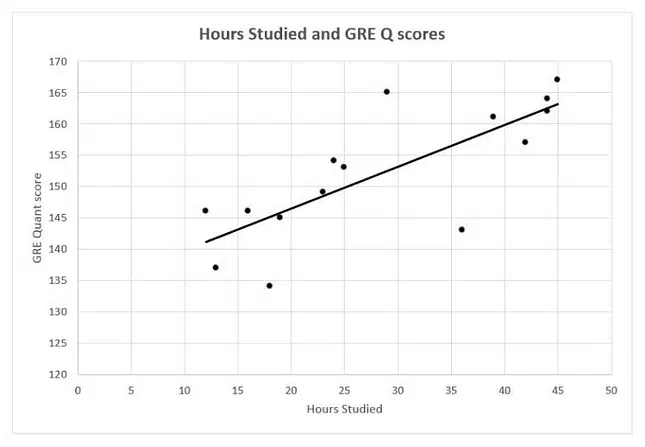
Many people's ages and weights are on the same graph as their yearly income. Coupled with their debt load, how many children they have, how many automobiles they own, and so on. For instance, a scatter plot may be used to display the correlation between the number of hours students spend studying at a university and their GRE Quant score. It is simple to respond to any queries about the information given here using this graph. You might be asked, for instance, which student with less than 30 hours of preparation received the greatest GRE quant score.
Tips to Answer GRE Data Analysis Questions
Since that is the most challenging component of GRE, data interpretation tips and tricks are the most important ones. Here are some pointers we've gathered to address the data interpretation queries:
- Scan the Data Presentation: To understand the question, candidates must quickly examine the data. But, do not spend a lot of time carefully going through every piece of information and it can play a vital role in your GRE prep. Concentrate on the graphs' axes, scales, units, and orders of magnitude as well as any remarks that offer more insight into the data.
- Read the Scale Properly: Read the scales, make estimates, or compare values by the respective scales when responding to graphical data displays. Consider broken scales and bars as examples. Because it is inaccurate and doesn't begin at 0,
- Know the Facts: Only the information provided should be used to answer the questions. Do not combine the fact with any of the prior test questions.
- GRE Data Analysis Practice Questions: Data analysis GRE practice questions needs rigorous practice. Daily practing this section helps candidates acing GRE score.
Candidates do not have the luxury of taking their time when answering questions on GRE. To respond more quickly, use formulas and shortcuts. In addition to percentages, ratios, fractions, and fundamental mathematical operations, GRE's data interpretation questions also cover other arithmetic concepts.
FAQs
Ques: What is data analysis in GRE?
Ques: Does GRE have data insights?
Ques: What is data interpretation in GRE?
Ques: What are the 2 types of GRE?
Ques: Is 320 a good GRE score?
Ques: How many data analysis questions are there in GRE?
Ques: Is GRE easier than GMAT?
Ques: Does Harvard prefer GMAT or GRE?
Ques: Can I do an MBA after a 3-year gap?
Ques: Are there statistics in GRE?
*The article might have information for the previous academic years, please refer the official website of the exam.