
IIT JAM 2025 Economics: Download Question Paper with Solution PDF


| Updated On - Sep 10, 2025
The IIT JAM 2025 Shift 2 was conducted on February 2, 2025 from 2:30pm to 5:30pm for Economics, Biotechnology, Physics and Mathematical Statistics. Economics question paper along with the solutions PDF is available to download here.
| IIT JAM 2025 Economics Question Paper PDF |  Download Download |
Check Solutions |

The IIT JAM 2025 Economics Question Paper with Solutions
For a positively skewed frequency distribution, ,...............
View Solution
In a positively skewed distribution (right-skewed), the tail of the distribution is longer on the right side. This causes the mean to be greater than the median, which is in turn greater than the mode. The general rule for skewed distributions is:
- In a positively skewed distribution, the mean is pulled towards the right tail, making it greater than both the median and mode.
- The mode is the least affected by extreme values and remains the smallest.
Therefore, for a positively skewed frequency distribution: \[ \boxed{Mean > Median > Mode} \]
Final Answer: \[ \boxed{Mean > Median > Mode} \] Quick Tip: For skewed distributions, the order of central tendency is always: Mean > Median > Mode in positively skewed and Mode > Median > Mean in negatively skewed distributions.
In 1991, ............. Committee was set up by the Government of India to examine the structure, organisation, and functions of the Indian financial system.
View Solution
The **Narasimham Committee**, set up in 1991, was tasked with examining the structure, organization, and functions of the Indian financial system. This committee played a pivotal role in recommending financial sector reforms, particularly in the banking sector, and is one of the most important committees in the history of India's financial reforms.
The committee's recommendations contributed significantly to shaping the financial liberalization policies in India, and its impact is still seen in the current financial structure.
Final Answer: \[ \boxed{Narasimham} \] Quick Tip: The Narasimham Committee's recommendations laid the foundation for the liberalization of India's banking and financial systems in the 1990s.
The inflation targeting policy adopted by the Reserve Bank of India in 2015 prescribed the targeted inflation to vary between ______ percent.
View Solution
In 2015, the Reserve Bank of India (RBI) adopted an **inflation targeting policy** with the aim to control inflation and stabilize the economy. Under this policy, the RBI set a target for consumer price index (CPI) inflation, which was prescribed to be within the range of **2% to 6%**.
This policy framework was introduced to ensure that inflation stays within a manageable range, which is crucial for economic stability. The target range has been a central part of India's monetary policy.
Final Answer: \[ \boxed{2 \, - \, 6} \] Quick Tip: The RBI's inflation targeting framework aims to maintain inflation within the range of 2% to 6% to ensure price stability in the economy.
Which one of the following is distinct from the others?
View Solution
- A **Histogram** is a graphical representation of the distribution of numerical data. It uses rectangular bars to represent data frequencies, where each bar's height corresponds to the frequency of data within a particular range.
- A **Pictogram** uses pictures or symbols to represent data values. Each symbol represents a specific quantity, and this makes it different from the other types of data representation.
- An **Ogive** is a graph that represents the cumulative frequency of data. It is constructed by plotting cumulative frequency against the upper class boundaries of a grouped frequency distribution.
- A **Frequency Polygon** is a graphical representation similar to a histogram, but it uses a line to represent frequencies instead of bars.
Thus, the **Pictogram** is distinct because it uses images instead of numerical bars or lines to represent data, unlike the other types which are based on frequencies.
Final Answer: \[ \boxed{Pictogram} \] Quick Tip: A pictogram uses pictures or symbols to represent data, making it distinct from other statistical graphs like histograms, ogives, and frequency polygons.
Which one of the following is the shut-down condition for a profit-maximizing firm in a perfectly competitive market?
P - Price, AVC - Average Variable Cost, ATC - Average Total Cost
View Solution
Step 1: Understand the shut-down condition.
In a perfectly competitive market, a firm maximizes profit by producing at the point where marginal cost equals marginal revenue. However, if the price falls below average variable cost (AVC), the firm cannot cover its variable costs, and it will choose to shut down in the short run.
Step 2: Explain the shut-down condition.
A firm will shut down if it cannot cover its variable costs, which happens when the price is less than the average variable cost (AVC). At this point, the firm incurs a loss equal to its fixed costs.
Thus, the shut-down condition is \( P < AVC \), meaning the price is less than the average variable cost.
Final Answer: \[ \boxed{P < AVC} \] Quick Tip: In the short run, a firm will continue producing as long as it can cover its variable costs. If price falls below AVC, the firm shuts down.
Which one of the following is CORRECT in the context of a natural monopoly?
View Solution
Step 1: Understand a natural monopoly.
A natural monopoly occurs when a single firm can supply the entire market demand at a lower cost than multiple firms. This happens because of high fixed costs and low variable costs, creating a situation where it is more efficient for only one firm to produce the good or service.
Step 2: Explanation of the options.
- Option (A) is incorrect. While monopolies can arise from limited natural resources, this is not a defining characteristic of a natural monopoly.
- Option (B) is correct. A key feature of a natural monopoly is that the firm experiences high fixed costs (such as infrastructure costs) and relatively low variable costs. This means it is more efficient for one firm to produce the good or service.
- Option (C) is incorrect because natural monopolies arise from cost advantages, not from government restrictions.
- Option (D) is incorrect. While Indian Railways is a government-owned enterprise, it does not represent a natural monopoly due to its monopoly status being primarily driven by governmental decisions rather than cost structures.
Final Answer: \[ \boxed{Total fixed cost is substantially larger than the total variable cost.} \] Quick Tip: Natural monopolies often have large fixed costs, like infrastructure, which makes it inefficient for multiple firms to operate in the same market.
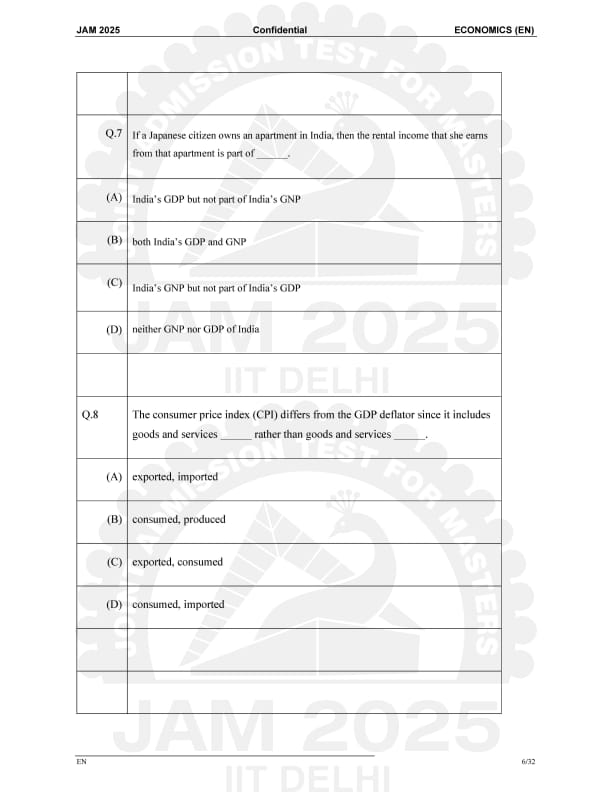
If a Japanese citizen owns an apartment in India, then the rental income that she earns from that apartment is part of
View Solution
Step 1: Understand the difference between GDP and GNP.
Gross Domestic Product (GDP) measures the value of goods and services produced within a country’s borders, regardless of who owns the productive assets. On the other hand, Gross National Product (GNP) accounts for the value produced by the residents of a country, including their income from assets abroad.
Step 2: Identify the impact of foreign ownership.
The rental income earned by a foreign citizen (in this case, a Japanese citizen) from property located in India is considered part of India’s GDP because it is income generated within the country’s borders, even though the owner is not a resident. However, this income is not part of India’s GNP because GNP includes income earned by Indian residents abroad, not foreign residents within India.
Thus, the rental income is part of India’s GDP but not part of India’s GNP.
Final Answer: \[ \boxed{India’s GDP but not part of India’s GNP} \] Quick Tip: Remember: GDP includes income generated within the country’s borders, while GNP includes income generated by the country’s residents, regardless of location.
The consumer price index (CPI) differs from the GDP deflator since it includes goods and services ............. rather than goods and services ...............
View Solution
Step 1: Understand CPI and GDP Deflator.
The Consumer Price Index (CPI) measures the average change in prices paid by consumers for a fixed basket of goods and services, including items that are consumed domestically, regardless of whether they are produced locally or imported.
The GDP deflator, on the other hand, is a measure of the price level of all domestically produced goods and services in an economy. It includes only the goods and services that are produced within the country, excluding imported goods.
Step 2: Compare the two indices.
The CPI includes goods and services that are consumed, regardless of where they are produced, while the GDP deflator includes only goods and services that are produced domestically.
Thus, the correct answer is that the CPI includes goods and services consumed, while the GDP deflator includes goods and services produced.
Final Answer: \[ \boxed{consumed, produced} \] Quick Tip: CPI focuses on the prices consumers pay, while the GDP deflator tracks the prices of domestically produced goods.
"Garibi Hatao" (removal of poverty) and "Growth with Justice" were the slogans of which Five Year Plan.
View Solution
Step 1: Understand the context of slogans.
"Garibi Hatao" (removal of poverty) and "Growth with Justice" were prominent slogans used during India's Fourth Five Year Plan. These slogans were part of the plan's focus on improving the standard of living for the marginalized sections of society, focusing on poverty alleviation and social justice.
Step 2: Identify the plan.
The Fourth Five Year Plan, which ran from 1969 to 1974, emphasized the removal of poverty and equitable economic development. The slogans "Garibi Hatao" and "Growth with Justice" were heavily associated with this plan.
Final Answer: \[ \boxed{Fourth} \] Quick Tip: The Fourth Five Year Plan focused on poverty alleviation and social justice.
Which is NOT a function of the Reserve Bank of India?
View Solution
Step 1: Understand the functions of the RBI.
The Reserve Bank of India (RBI) is India's central bank and performs several key functions:
- It is the Bank of issues, meaning it has the authority to issue currency notes.
- It acts as the banker to the government, providing banking services to the central and state governments.
- It controls credit in the economy by regulating the monetary policy, ensuring liquidity, and managing inflation.
Step 2: Identify the incorrect function.
Lending to businesses is not a direct function of the RBI. While the RBI regulates commercial banks, it does not directly lend to businesses; instead, it controls the monetary policy that influences commercial lending.
Final Answer: \[ \boxed{Lending to businesses} \] Quick Tip: The RBI regulates the banking system and controls credit but does not lend directly to businesses.
In statistical hypothesis testing, the area of non-rejection is defined as
View Solution
Step 1: Understand the concept of non-rejection.
In statistical hypothesis testing, the term "non-rejection" refers to the probability that we fail to reject the null hypothesis when it is in fact true. This area corresponds to the acceptance region of the null hypothesis in the test. The concept of non-rejection is important in evaluating the power of a hypothesis test and understanding its behavior.
Step 2: Explanation of the options.
- Option (A) is correct. "One minus probability of rejecting the Null hypothesis when it is true" refers to the probability of correctly accepting the null hypothesis when it is true. This is the concept of "non-rejection."
- Option (B) is incorrect because it involves the probability of non-rejection when the null hypothesis is false, which isn't the definition of the non-rejection area.
- Option (C) is incorrect because it involves comparing the probabilities of rejection and non-rejection, which isn't a valid interpretation of the non-rejection area.
- Option (D) is incorrect because it refers only to rejection, not non-rejection.
Final Answer: \[ \boxed{one minus probability of rejecting the Null hypothesis when it is true} \] Quick Tip: In hypothesis testing, the non-rejection area corresponds to the probability of failing to reject the null hypothesis when it is false.
If \( \hat{\beta} \) is a consistent estimator of a population parameter \( \beta \); \( \epsilon \) and \( \delta \) are very small quantities, then ..........
View Solution
Step 1: Understand consistency of an estimator.
An estimator \( \hat{\beta} \) is consistent if, as the sample size tends to infinity, it converges in probability to the true value of the parameter \( \beta \). This means that for any small \( \epsilon > 0 \), the probability that the estimate \( \hat{\beta} \) is within \( \epsilon \) of \( \beta \) approaches 1 as the sample size increases.
Step 2: Explanation of the options.
- Option (A) is correct. By the definition of consistency, the probability that the estimator \( \hat{\beta} \) is within an \( \epsilon \) distance from \( \beta \) increases as the sample size grows. In other words, for small \( \epsilon \), the probability that \( \hat{\beta} \) is farther than \( \epsilon \) from \( \beta \) becomes very small, i.e., \( Prob \left( \left| \hat{\beta} - \beta \right| \geq \epsilon \right) \leq \delta \). This implies that the probability of the estimator being close to \( \beta \) is at least \( 1 - \delta \).
- Option (B) is incorrect because, while \( \hat{\beta} \) is consistent, the probability of \( \hat{\beta} \) being exactly equal to \( \beta \) is 0, not necessarily 0 for small \( \epsilon \).
- Option (C) is incorrect because \( \delta \) is a very small quantity, and the probability that the estimator is within \( \epsilon \) of \( \beta \) should be close to 1, not equal to \( \delta \).
- Option (D) is incorrect because the probability cannot exceed 1, and \( 1 + \delta \) is not a valid probability.
Final Answer: \[ \boxed{Prob \left( \left| \hat{\beta} - \beta \right| \geq \epsilon \right) \geq 1 - \delta} \] Quick Tip: Consistency of an estimator ensures that as the sample size increases, the probability of the estimate being within a small \( \epsilon \) of the true value increases.
Power of a statistical test is defined as
View Solution
Step 1: Understand the concept of the power of a statistical test.
The power of a statistical test is the probability that the test will correctly reject a false null hypothesis. In other words, it measures the ability of a test to detect a true effect (if there is one) and avoid Type II errors (failing to reject a false null hypothesis).
Step 2: Analyze the options.
- Option (A) is incorrect because it represents the complement of the Type I error rate (probability of rejecting a true null hypothesis).
- Option (B) is correct. The power of a statistical test is the probability of rejecting the null hypothesis when it is false (true positive rate), which is defined as \(1 - \beta\), where \( \beta \) is the probability of not rejecting the null hypothesis when it is false.
- Option (C) is incorrect because it refers to the difference between rejecting the null hypothesis when it is true and not rejecting the null hypothesis when it is false, which doesn't directly define power.
- Option (D) is incorrect because it represents the probability of failing to reject the null hypothesis when it is false, which relates to Type II error.
Final Answer: \[ \boxed{one minus probability of not rejecting the Null hypothesis when it is not true} \] Quick Tip: The power of a statistical test is a measure of the test's ability to detect an effect when one exists, and is calculated as \( 1 - \beta \), where \( \beta \) is the probability of a Type II error.
If \( Y = L^a K^b \) is a Cobb-Douglas production function with two factors labor and capital, then the presence of constant returns to scale exhibited by the production function can be tested using ...........
View Solution
Step 1: Understand the Cobb-Douglas production function.
The Cobb-Douglas production function is widely used to model the relationship between inputs (labor and capital) and output. It is typically written as: \[ Y = L^a K^b \]
where \( Y \) is the output, \( L \) is labor, \( K \) is capital, and \( a \) and \( b \) are the output elasticities of labor and capital, respectively.
Step 2: What does constant returns to scale mean?
Constant returns to scale imply that if all inputs are increased by the same proportion, output will increase by that same proportion. Mathematically, this condition is met when: \[ a + b = 1 \]
If \( a + b > 1 \), it indicates increasing returns to scale, and if \( a + b < 1 \), it indicates decreasing returns to scale.
Step 3: Which statistical test to use?
To test for constant returns to scale, we need to test the hypothesis that \( a + b = 1 \). This can be tested using an \( F \)-test, which is used to test linear restrictions on parameters in econometric models. Additionally, we can also use a \( t \)-statistic for individual coefficient testing, especially when testing the individual parameters \( a \) and \( b \).
- Option (A) is incorrect because the \( t \)-statistic is used to test individual coefficients, not joint hypotheses like \( a + b = 1 \).
- Option (B) is correct because the \( F \)-statistic is used to test joint hypotheses, such as \( a + b = 1 \).
- Option (C) is correct as both the \( t \)-statistic and \( F \)-statistic can be used to test different aspects of the hypothesis (joint and individual parameters).
- Option (D) is incorrect because the \( \chi^2 \)-statistic is not used for testing the returns to scale in this case.
Final Answer: \[ \boxed{both t and F statistic} \] Quick Tip: To test for constant returns to scale in a Cobb-Douglas production function, use the \( F \)-test for joint hypotheses or the \( t \)-test for individual parameters.
In the context where sample mean of the dependent variable \( Y \) lies closer to the observed \( Y_1 \) than its least square predictor \( \hat{Y}_1 \), ............
View Solution
Step 1: Understand the concept of goodness of fit.
The goodness of fit, often represented by \( R^2 \), is a measure of how well the regression model fits the observed data. It is calculated as the square of the correlation between the observed and predicted values of the dependent variable.
Step 2: Analyze the options.
- Option (A) is correct. If the sample mean of the dependent variable \( Y \) is closer to the observed value than the least square predictor \( \hat{Y}_1 \), it indicates that the model is performing worse than just using the sample mean. In such cases, the goodness of fit \( R^2 \) can be negative, indicating that the model is worse than a horizontal line representing the mean.
- Option (B) is incorrect because the goodness of fit \( R^2 \) equals 1 only when the regression line perfectly fits the data, which is not always the case.
- Option (C) is incorrect because \( R^2 = 0 \) indicates that the model explains none of the variation in the dependent variable, not that it lies closer to the observed value.
- Option (D) is incorrect because although \( R^2 \) is usually between 0 and 1, it can be negative when the model fits worse than the simple average model.
Final Answer: \[ \boxed{the goodness of fit (R^2) is negative} \] Quick Tip: The goodness of fit \( R^2 \) measures how well the model explains the variation in the dependent variable, and it can be negative if the model fits worse than the simple mean.
Which one of the following statements is CORRECT?
View Solution
Step 1: Understand the cash reserve ratio (CRR) and money multiplier.
The cash reserve ratio (CRR) is the proportion of a bank's total deposits that must be kept in reserve with the central bank. The money multiplier is a factor that determines how much money supply will increase as a result of an initial deposit. It is inversely related to the CRR.
Step 2: Analyze the options.
- Option (A) is correct. The money multiplier is given by \( \frac{1}{CRR} \). A higher CRR means that banks must hold more reserves, reducing the amount of money they can lend out, and thus reducing the money multiplier.
- Option (B) is incorrect because a higher CRR reduces the money multiplier, not increases it.
- Option (C) is incorrect because if banks hold all deposits as reserves (i.e., CRR = 1), the money multiplier becomes 1, not larger.
- Option (D) is incorrect because the cash reserve ratio directly influences the money multiplier.
Final Answer: \[ \boxed{Higher the cash reserve ratio, smaller the money multiplier.} \] Quick Tip: The money multiplier is inversely related to the cash reserve ratio: a higher CRR means a smaller money multiplier.
Public sector undertakings can affect the government exchequer through
View Solution
Step 1: Understand the role of public sector undertakings.
Public sector undertakings (PSUs) are government-owned corporations or companies that operate in various sectors. These undertakings can contribute to the government exchequer in multiple ways.
Step 2: Analyze the options.
- Option (A) is incorrect because public sector undertakings do not just contribute through tax payments but also through dividends and interest payments.
- Option (B) is incorrect because PSUs also contribute through tax payments and not just dividends.
- Option (C) is correct because public sector undertakings contribute to the government exchequer through dividends, interest payments on loans, and tax payments.
- Option (D) is incorrect because interest payments are just one of the ways, not the only way PSUs contribute to the government.
Final Answer: \[ \boxed{dividend, interest, and tax payments} \] Quick Tip: Public sector undertakings contribute to the government's finances through various payments, including dividends, interest on loans, and taxes.
According to the IS-LM model, if the central bank increases money supply, then the rate of interest will ........... and the income will ..............
View Solution
Step 1: Understand the IS-LM model.
The IS-LM model is a macroeconomic model that shows the relationship between interest rates (I) and output (Y) in the goods market (IS curve) and the money market (LM curve). The LM curve represents equilibrium in the money market, where the demand for money equals the supply.
Step 2: Effect of an increase in money supply.
When the central bank increases the money supply, it shifts the LM curve to the right, leading to a decrease in interest rates. Lower interest rates make investment more attractive, leading to an increase in income (output).
Thus, when the central bank increases the money supply, the interest rate falls and income rises.
Final Answer: \[ \boxed{fall, rise} \] Quick Tip: In the IS-LM model, an increase in money supply leads to a decrease in interest rates and an increase in income due to greater investment.
Consider the following cases:
I. Rosy buys a 50-year-old house for her family this year.
II. This year, Cathy builds a new house for herself.
The total investment in the economy in this context is ..........
View Solution
Step 1: Understand investment in the economy.
In national income accounting, investment is the expenditure on new capital goods that increase the economy’s productive capacity. Buying an existing house is considered consumption, not investment, since no new production occurs.
Step 2: Analyze the cases.
- Rosy buying a 50-year-old house is considered consumption, not investment, as the house is already built and no new capital is created.
- Cathy building a new house for herself is considered investment because it is the construction of new capital.
Thus, the total investment in the economy is only the new house Cathy builds, which counts as 1 house.
Final Answer: \[ \boxed{1 house} \] Quick Tip: Only new constructions are counted as investment in national income accounting. Buying existing assets is considered consumption.
Consider a firm that produces a single good using labour and capital. Let \( C, Q, L, K, w, r, p \) denote cost of production, level of output, labour, capital, wage rate, price of capital, and the price of output, respectively.
An example of the cost function for this firm is .........
View Solution
Step 1: Understand the cost function.
The cost function represents the total cost of producing a certain level of output, taking into account the inputs (labour and capital) and their respective prices (wage rate and price of capital).
Step 2: Analyze the options.
- Option (A) is incorrect because the correct cost function is not simply the sum of labor and capital costs; there is a more complex relationship at play.
- Option (B) is incorrect because the cost function is not the minimum of labor and capital costs.
- Option (C) is incorrect because this formula does not correctly represent a typical cost function for the firm.
- Option (D) is correct because it introduces a relationship between output, the wage rate, and the capital price that fits the nature of cost functions.
Final Answer: \[ \boxed{C = Q\sqrt{w}w} \] Quick Tip: The cost function typically involves a relationship between output and input prices, with additional factors like scaling for labor and capital.
Consider a consumer with the utility function, \( U(x, y) = y + \sqrt{x} \), where \( x \) and \( y \) are quantities of two commodities consumed.
Which one of the following is TRUE?
View Solution
Step 1: Utility function analysis.
The given utility function is \( U(x, y) = y + \sqrt{x} \). To determine income elasticity, we first need to find the demand functions for both goods using the utility maximization approach.
Step 2: Deriving income elasticity.
The income elasticity of demand measures the responsiveness of the quantity demanded of a good to changes in income. It is given by the formula: \[ \epsilon = \frac{dQ}{dI} \times \frac{I}{Q} \]
where \( Q \) is the quantity demanded and \( I \) is the income.
For good \( x \), the utility function has a square root form, which leads to a demand that is less sensitive to income changes (i.e., an income elasticity of 0).
Step 3: Answer explanation.
- Option (A) is incorrect because the income elasticity of demand for both goods is not 1.
- Option (B) is correct because the income elasticity for \( x \) is 0, meaning that changes in income have no effect on the demand for good \( x \).
- Option (C) is incorrect because the income elasticity for \( y \) is not 0.
- Option (D) is incorrect because the values given for the elasticities do not match the utility function.
Final Answer: \[ \boxed{Income elasticity of demand for good x is 0.} \] Quick Tip: Income elasticity for goods with square root demand functions is typically low, reflecting inelastic demand with respect to income.
In a two-goods consumption framework, Engel curve shows the relationship between ..........
View Solution
Step 1: Understand the Engel curve.
The Engel curve shows how the quantity demanded of a good changes as income changes, holding other factors constant. It represents the relationship between a consumer's income and the amount of a good they demand.
Step 2: Analyze the options.
- Option (A) is incorrect because the Engel curve does not represent the relationship between the price of one good and the quantity demanded of the other.
- Option (B) is incorrect because the Engel curve does not show the relative price of goods but focuses on income and demand.
- Option (C) is correct because the Engel curve specifically relates income to the quantity demanded of one good.
- Option (D) is incorrect because the Engel curve does not show the ratio of quantities demanded but focuses on individual goods.
Final Answer: \[ \boxed{income and quantity demanded of one of the goods} \] Quick Tip: The Engel curve shows how the demand for a good changes as income changes, illustrating consumer behavior with respect to income variations.
Theory of revealed preference is used to derive ............
View Solution
Step 1: Understand the theory of revealed preference.
The theory of revealed preference is a method used to understand consumer preferences by observing their choices in different situations, rather than relying on direct utility functions. It is based on the idea that a consumer's preferences can be revealed by their purchasing decisions when facing different prices and income levels.
Step 2: Analyze the options.
- Option (A) is incorrect because the theory is not primarily used to determine optimal choice using preference.
- Option (B) is incorrect because the revealed preference theory deals with preferences rather than income levels.
- Option (C) is correct because it uses prices, incomes, and optimal choices to derive consumer preferences.
- Option (D) is incorrect because the theory focuses on consumer preferences rather than prices directly.
Final Answer: \[ \boxed{preference, using prices, incomes, and optimal choice information} \] Quick Tip: The theory of revealed preference helps to derive consumer preferences by observing their choices under different income and price conditions.
Consider the statements I and II in a monopolistically competitive market scenario:
I. In the long-run equilibrium, the price of the good will be equal to the minimum of the average total cost.
II. In the short run, firms may earn a positive profit.
Which of the following options is CORRECT?
View Solution
Step 1: Understand monopolistic competition.
In monopolistic competition, firms sell differentiated products, and there is free entry and exit in the long run. In the long-run equilibrium, firms produce at a point where price equals average total cost, but the price may not necessarily be at the minimum of the average total cost curve.
Step 2: Analyze the statements.
- Statement I is incorrect. In the long-run equilibrium, the price in a monopolistically competitive market equals average total cost, but it is not necessarily at the minimum of the ATC curve. Firms can operate at an inefficient point on the ATC curve.
- Statement II is correct. In the short run, firms in monopolistic competition can earn positive profits due to product differentiation and pricing power, but this will not last in the long run as firms enter the market.
Final Answer: \[ \boxed{I is FALSE but II is TRUE} \] Quick Tip: In the short run, firms in monopolistic competition can earn profits, but in the long run, the price equals average total cost, though not necessarily at the minimum of the ATC curve.
If average variable cost (AVC) curve is an upward sloping straight line through the origin, then the marginal cost curve will be ............
View Solution
Step 1: Understand the relationship between AVC and MC.
The average variable cost (AVC) curve and marginal cost (MC) curve are related. The marginal cost curve intersects the AVC curve at its minimum point. When the AVC curve is a straight line, the marginal cost curve will also be a straight line, but steeper.
Step 2: Analyze the options.
- Option (A) is correct because when the AVC curve is an upward sloping straight line through the origin, the MC curve is also a straight line passing through the origin, and it is steeper than the AVC curve.
- Option (B) is incorrect because the MC curve would not be flatter than the AVC curve in this case.
- Option (C) is incorrect because a "U-shaped" curve for MC occurs when there are diminishing returns, which is not the case here.
- Option (D) is incorrect because the MC curve does not have a positive vertical intercept when AVC passes through the origin.
Final Answer: \[ \boxed{upward sloping straight line through the origin and steeper than the AVC curve} \] Quick Tip: The marginal cost curve always intersects the average variable cost curve at its minimum point. When AVC is a straight line, the MC curve is also straight and steeper.
In the case of ‘liquidity trap’, ..........
View Solution
Step 1: Understand the liquidity trap.
A liquidity trap occurs when interest rates are so low that they cannot be reduced further to stimulate investment. In this situation, the demand for money becomes highly elastic, and increasing the money supply does not lead to increased investment or consumption.
Step 2: Analyze the options.
- Option (A) is incorrect because in a liquidity trap, monetary policy becomes ineffective as the economy is stuck with low interest rates and no incentive to borrow more.
- Option (B) is incorrect because hyperinflation is not typically associated with a liquidity trap.
- Option (C) is incorrect because interest rates cannot fall significantly in a liquidity trap, as they are already near zero.
- Option (D) is correct. In a liquidity trap, expansionary monetary policy, such as increasing the money supply, does not effectively stimulate the economy because the demand for money becomes perfectly elastic.
Final Answer: \[ \boxed{expansionary monetary policy is completely ineffective} \] Quick Tip: In a liquidity trap, monetary policy becomes ineffective because interest rates are already at very low levels, and people prefer holding money rather than spending or investing it.
Mid-day meal scheme for Indian school children was first introduced in ............
View Solution
Step 1: Understand the origin of the scheme.
The mid-day meal scheme was first introduced by the Madras Corporation (now Chennai) in 1925 to provide free lunches to school children in the city. The scheme was later expanded to other regions of India.
Step 2: Analyze the options.
- Option (A) is incorrect because the scheme was not first introduced in Calcutta (now Kolkata).
- Option (B) is correct because the Madras Corporation initiated the mid-day meal scheme in 1925.
- Option (C) is incorrect because Trivandrum did not implement the scheme first.
- Option (D) is incorrect because the scheme was not first introduced in Bombay (now Mumbai).
Final Answer: \[ \boxed{Madras Corporation} \] Quick Tip: The mid-day meal scheme was first implemented in Madras in 1925 to combat hunger and promote education.
Tax buoyancy is defined as .............
View Solution
Step 1: Understand tax buoyancy.
Tax buoyancy refers to the responsiveness of tax revenue to changes in the tax base. It is a measure of how much tax revenue increases or decreases when the tax base (such as income or output) changes.
Step 2: Analyze the options.
- Option (A) is incorrect because tax buoyancy is not just the growth in tax revenue; it measures the relative change to the tax base.
- Option (B) is incorrect because tax buoyancy is not directly related to the change in tax rate.
- Option (C) is correct. Tax buoyancy is defined as the percentage change in tax revenue relative to the percentage change in the tax base.
- Option (D) is incorrect because tax buoyancy is unrelated to changes in government expenditure.
Final Answer: \[ \boxed{percentage change in tax revenue as a ratio to percentage change in tax base} \] Quick Tip: Tax buoyancy measures how effectively the government’s tax system responds to changes in the economy’s tax base.
You are measuring level of consumption of a good commodity on the X-axis and that of a bad commodity on the Y-axis. The indifference curve is ............
View Solution
Step 1: Understand the concept of indifference curve.
An indifference curve represents all combinations of two goods that give the consumer the same level of satisfaction or utility. The shape of the indifference curve depends on whether the goods are substitutes or complements.
Step 2: Analyze the given scenario.
In this case, one good is placed on the X-axis and a bad commodity on the Y-axis. For bad commodities, the consumer prefers to have less of them. The indifference curve for such commodities would slope positively, meaning that if the consumer consumes more of the good (on the X-axis), they would need to consume more of the bad (on the Y-axis) to remain equally satisfied.
Step 3: Answer explanation.
- Option (A) is incorrect because the indifference curve would not be parallel to the X-axis as we expect a trade-off between the two commodities.
- Option (B) is incorrect because an indifference curve parallel to the Y-axis would suggest no change in the consumer's satisfaction level with respect to changes in the Y-axis good, which isn't typical when dealing with bad commodities.
- Option (C) is incorrect because the "inverted-U" shape does not apply in this case.
- Option (D) is correct because, in the case of a bad commodity on the Y-axis, the indifference curve typically has a positive slope. The consumer prefers more of the good on the X-axis and will tolerate more of the bad on the Y-axis to maintain satisfaction.
Final Answer: \[ \boxed{having a positive slope} \] Quick Tip: When dealing with a bad commodity on the Y-axis, the indifference curve will have a positive slope, indicating a trade-off where the consumer consumes more of the bad as they increase consumption of the good.
Marginal utility of a good refers to the ............
View Solution
Step 1: Understand marginal utility.
Marginal utility refers to the additional satisfaction or utility that a person receives from consuming one more unit of a good or service.
Step 2: Analyze the options.
- Option (A) is incorrect because marginal utility specifically refers to the additional utility from consuming an additional unit, not just consuming the good in general.
- Option (B) is incorrect because the change in utility is from the consumption of some additional units, but it is the rate of change, not just the change itself.
- Option (C) is correct because marginal utility is defined as the rate of change in utility with respect to a one-unit change in the quantity consumed, which is how it is traditionally measured.
- Option (D) is incorrect because marginal utility is based on changes in consumption, not changes in expenditure.
Final Answer: \[ \boxed{rate of change in utility from per unit change in consumption of the good} \] Quick Tip: Marginal utility measures how much additional utility is gained from consuming one more unit of a good.
Which of the following statements describe(s) the relationship between \( R^2 \) and adjusted \( R^2 \) (denoted by \( \bar{R}^2 \))?
View Solution
Step 1: Understand the relationship between \( R^2 \) and adjusted \( R^2 \).
- \( R^2 \) measures the proportion of the variance in the dependent variable that is explained by the independent variables in the regression model. However, \( R^2 \) always increases when more independent variables are added, even if those variables are not meaningful.
- Adjusted \( R^2 \) (denoted \( \bar{R}^2 \)) adjusts for the number of explanatory variables in the model. It can decrease if the new variable does not improve the model significantly.
Step 2: Analyze the options.
- Option (A) is incorrect because while \( R^2 = 1 \) indicates a perfect fit, the adjusted \( R^2 \) can also be 1 if the model is perfectly fit, but adding extra variables that don't contribute might decrease it.
- Option (B) is correct because when \( R^2 = 0 \), the model explains no variance, and the adjusted \( R^2 \) can become negative, which reflects that the model is worse than a simple mean model.
- Option (C) is incorrect because if \( R^2 = 1 \), then \( \bar{R}^2 \) will also be 1, as no adjustments are needed.
- Option (D) is incorrect because \( R^2 = 0 \) implies no explanatory power, and \( \bar{R}^2 \) would likely be negative, not 1.
Final Answer: \[ \boxed{If R^2 = 0, then \bar{R}^2 can be negative.} \] Quick Tip: Adjusted \( R^2 \) accounts for the number of predictors in the model and can be negative if the model does not improve the fit.
Which of the following is/are NOT the assumption(s) of Classical Linear Regression Model (CLRM)?
View Solution
Step 1: Understand the assumptions of the Classical Linear Regression Model (CLRM).
The assumptions of CLRM are crucial for the Ordinary Least Squares (OLS) estimates to be the Best Linear Unbiased Estimators (BLUE). The assumptions include:
1. Linearity in both parameters and variables.
2. No correlation between the explanatory variables and the error term (\( Cov(X_i, u_i) = 0 \)).
3. No correlation between the dependent variable and the error term (\( Cov(Y_i, u_i) = 0 \)).
4. Homoscedasticity: Constant variance of the error term.
5. The error term should have zero mean.
Step 2: Analyze the options.
- Option (A) is incorrect because the assumption of CLRM does not require the variance of the dependent variable to be greater than the variance of the explanatory variable. This is not part of the CLRM assumptions.
- Option (B) is correct because the model must be linear in both the parameters (coefficients) and variables for the assumptions to hold.
- Option (C) is correct because the error term must have zero covariance with the dependent variable, as the error should not be systematically related to the observations.
- Option (D) is correct because the explanatory variables should not be correlated with the error term, which ensures that the model provides unbiased estimates.
Final Answer: \[ \boxed{Variance of the dependent variable (Y_i) is greater than the variance of the explanatory variable (X_i) is NOT an assumption of CLRM.} \] Quick Tip: In CLRM, the assumption regarding the relationship between the variance of the dependent and explanatory variables is not a required assumption for the validity of the regression model.
Which of the following is/are NOT TRUE?
View Solution
Step 1: Understand the properties of each statement.
- Option (A) is true because the arithmetic mean is always greater than or equal to the geometric mean for any set of positive values (by the Arithmetic Mean-Geometric Mean inequality).
- Option (B) is incorrect. The correlation coefficient between two variables ranges from -1 to 1, not just between 0 and 1.
- Option (C) is true. The exact middle point of the real line between \( -\infty \) and \( \infty \) is 0, since it's the midpoint.
- Option (D) is true. The domain of the \( \chi^2 \) distribution with one degree of freedom is indeed [0, \( \infty \)], as \( \chi^2 \) distributions are defined for non-negative values.
Final Answer: \[ \boxed{Correlation coefficient between two variables varies between 0 and 1 is NOT TRUE.} \] Quick Tip: The correlation coefficient ranges from -1 to 1. A value of 1 indicates perfect positive correlation, and -1 indicates perfect negative correlation.
Which of the following is/are the shock(s) to the IS curve?
View Solution
Step 1: Understand the IS curve.
The IS curve represents equilibrium in the goods market, where investment equals savings. Shocks to the IS curve typically affect aggregate demand.
Step 2: Analyze each option.
- Option (A) is correct because changes in the demand for consumer goods affect aggregate demand, and thus shift the IS curve.
- Option (B) is correct because changes in expectations of future economic conditions (optimism/pessimism) can influence investment and consumption, shifting the IS curve.
- Option (C) is incorrect because changes in the demand for money are typically a shock to the LM curve (liquidity preference-money supply).
- Option (D) is correct because changes in government purchases directly affect aggregate demand and hence the IS curve.
Final Answer: \[ \boxed{(A), (B), and (D) are shocks to the IS curve.} \] Quick Tip: The IS curve is sensitive to changes in demand for goods, government spending, and consumer sentiment.
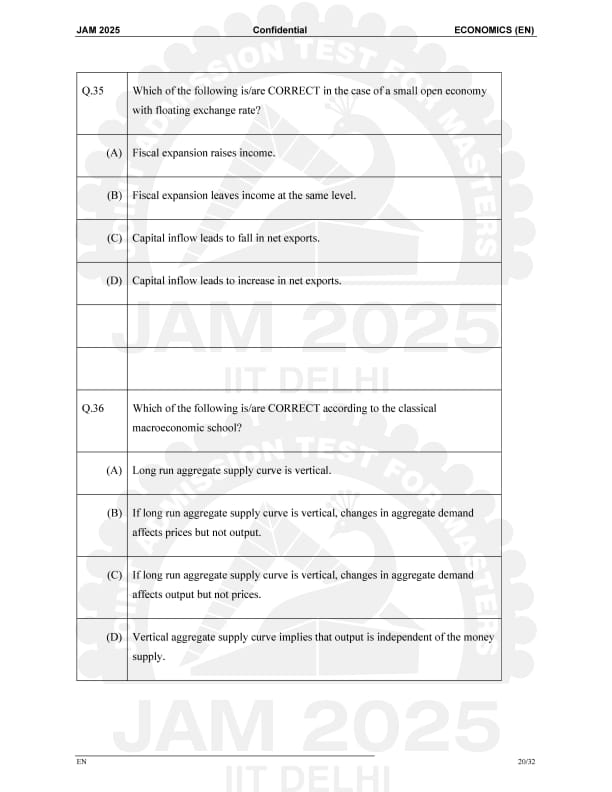
Which of the following is/are CORRECT in the case of a small open economy with floating exchange rate?
View Solution
Step 1: Understand the impact of fiscal policy and capital inflows in a small open economy.
In a small open economy with floating exchange rates, fiscal expansion and capital flows have significant effects on income, exchange rates, and net exports.
Step 2: Analyze the options.
- Option (A) is incorrect. In a small open economy with a floating exchange rate, fiscal expansion does not always raise income in the long run. It may raise domestic income in the short run, but it can lead to higher interest rates and currency appreciation, which could offset the expansionary effect.
- Option (B) is correct. Fiscal expansion can have no long-term effect on income due to crowding out and the appreciation of the exchange rate.
- Option (C) is correct. Capital inflows lead to an appreciation of the domestic currency, which makes exports more expensive and thus reduces net exports.
- Option (D) is incorrect. Capital inflows typically appreciate the currency, making exports more expensive and leading to a decrease in net exports.
Final Answer: \[ \boxed{(B) and (C) are correct in the case of a small open economy with floating exchange rate.} \] Quick Tip: In a small open economy with floating exchange rates, fiscal expansion can have a limited or neutral effect on income in the long term, and capital inflows typically lead to a decrease in net exports due to currency appreciation.
Which of the following is/are CORRECT according to the classical macroeconomic school?
View Solution
Step 1: Understand the classical macroeconomic view on aggregate supply.
According to the classical macroeconomic theory, the long-run aggregate supply (LRAS) curve is vertical because the economy’s potential output is determined by factors like technology, labor, and capital, which are unaffected by changes in aggregate demand.
Step 2: Analyze the options.
- Option (A) is correct because in the long run, the aggregate supply curve is vertical at the natural level of output.
- Option (B) is correct because if the LRAS is vertical, changes in aggregate demand only affect prices in the long run, not output.
- Option (C) is incorrect because in the classical model, output is not affected by changes in aggregate demand in the long run.
- Option (D) is correct because a vertical LRAS implies that output is independent of the money supply, as the money supply only affects prices in the long run.
Final Answer: \[ \boxed{(A), (B), and (D) are correct according to the classical macroeconomic school.} \] Quick Tip: In classical macroeconomics, the long-run aggregate supply curve is vertical, meaning output is independent of aggregate demand and the money supply in the long run.
In the case of first-degree price discrimination, which of the following statements is/are CORRECT in the long run?
View Solution
Step 1: Understand first-degree price discrimination.
First-degree price discrimination, also known as personalized pricing or perfect price discrimination, occurs when a firm charges each consumer the maximum price they are willing to pay for a good or service.
Step 2: Analyze each option.
- Option (A) is incorrect because, under first-degree price discrimination, total surplus (which includes consumer surplus and producer surplus) is maximized, and all of it becomes the producer's surplus, not just profit.
- Option (B) is correct because under first-degree price discrimination, the consumer surplus is entirely extracted by the firm and hence is zero.
- Option (C) is incorrect because deadweight loss is zero in the case of first-degree price discrimination since every consumer is charged exactly what they are willing to pay.
- Option (D) is incorrect because producer surplus is maximized under first-degree price discrimination, not zero.
Final Answer: \[ \boxed{Consumer surplus is equal to zero in the case of first-degree price discrimination.} \] Quick Tip: First-degree price discrimination results in no consumer surplus, as the firm captures all of it in the form of producer surplus.
Which of the following statements is/are CORRECT for diseconomies of scale?
View Solution
Step 1: Understand diseconomies of scale.
Diseconomies of scale occur when a firm expands its production, and the cost per unit increases due to inefficiencies. This typically happens when a firm grows too large and starts experiencing internal inefficiencies.
Step 2: Analyze each option.
- Option (A) is incorrect because in diseconomies of scale, the cost increases disproportionately with output. This means the elasticity of cost with respect to output is greater than one.
- Option (B) is correct. Diseconomies of scale lead to a situation where the elasticity of cost with respect to output is greater than one, meaning that cost increases at a faster rate than output.
- Option (C) is incorrect because when a firm experiences diseconomies of scale, the cost elasticity is greater than one.
- Option (D) is correct because, under diseconomies of scale, marginal cost is greater than average cost, which indicates increasing costs with additional output.
Final Answer: \[ \boxed{The elasticity of cost with respect to output is greater than one in diseconomies of scale.} \] Quick Tip: In diseconomies of scale, the cost rises faster than output, leading to higher marginal costs compared to average costs.
Market failure occur(s) in the presence of which of the following?
View Solution
Step 1: Understand market failure.
Market failure occurs when the allocation of goods and services by a free market is not efficient. It may happen in the presence of externalities, public goods, or market power.
Step 2: Analyze each option.
- Option (A) is correct because externalities, such as pollution, cause market failure as they result in unaccounted costs or benefits to third parties.
- Option (B) is correct because public goods are non-excludable and non-rivalrous, which often leads to market failure because private firms will not produce them in sufficient quantity.
- Option (C) is correct because market power, such as a monopoly, can lead to inefficiency in the market as monopolists can set prices above the competitive equilibrium, reducing overall welfare.
- Option (D) is incorrect because private goods do not cause market failure; they are typically efficiently allocated by the market.
Final Answer: \[ \boxed{Market failure occurs in the presence of externality, public goods, and market power.} \] Quick Tip: Market failure arises when there are externalities, public goods, or market power preventing efficient allocation.
Which of the following reference period(s) is/are used by the National Sample Survey for measuring employment and unemployment?
View Solution
Step 1: Understand the reference period for NSS surveys.
The National Sample Survey (NSS) uses different reference periods to measure various employment and unemployment indicators.
Step 2: Analyze each option.
- Option (A) is correct. The NSS uses a reference period of one year for measuring annual labor force participation and employment.
- Option (B) is incorrect because one month reference period is typically used to measure current employment, not unemployment.
- Option (C) is correct. The NSS also uses a one-week reference period for measuring short-term employment and unemployment.
- Option (D) is incorrect because a daily reference period is not used for measuring employment/unemployment data in the NSS.
Final Answer: \[ \boxed{(A), (C) are correct, while (D) is incorrect.} \] Quick Tip: NSS typically uses reference periods of one year, one month, and one week to measure employment and unemployment status depending on the nature of the survey.
The correlation coefficient between \(x\) and \(y\) using the following information is (rounded off to two decimal places).
\[ \sum_{i=1}^{100} x_i = 280, \quad \sum_{i=1}^{100} y_i = 60, \quad \sum_{i=1}^{100} x_i^2 = 2384, \quad \sum_{i=1}^{100} y_i^2 = 117, \quad \sum_{i=1}^{100} x_i y_i = 438 \]
View Solution
The formula for the correlation coefficient \(r\) is:
\[ r = \frac{n \sum x_i y_i - \sum x_i \sum y_i}{\sqrt{[n \sum x_i^2 - (\sum x_i)^2][n \sum y_i^2 - (\sum y_i)^2]}} \]
Where:
- \(n = 100\) (the number of data points),
- \(\sum x_i = 280\),
- \(\sum y_i = 60\),
- \(\sum x_i^2 = 2384\),
- \(\sum y_i^2 = 117\),
- \(\sum x_i y_i = 438\).
Substituting these values into the formula:
\[ r = \frac{100 \times 438 - 280 \times 60}{\sqrt{[100 \times 2384 - 280^2][100 \times 117 - 60^2]}} \]
Simplifying the numerator:
\[ 100 \times 438 = 43800, \quad 280 \times 60 = 16800 \]
\[ Numerator = 43800 - 16800 = 27000 \]
Simplifying the denominator:
\[ 100 \times 2384 = 238400, \quad 280^2 = 78400 \] \[ 100 \times 117 = 11700, \quad 60^2 = 3600 \] \[ Denominator = \sqrt{(238400 - 78400)(11700 - 3600)} = \sqrt{160000 \times 8100} = \sqrt{1296000000} \]
\[ Denominator = 35960 \]
Thus, the correlation coefficient \(r\) is:
\[ r = \frac{27000}{35960} \approx 0.75 \]
Final Answer: \[ \boxed{0.75} \] Quick Tip: To calculate the correlation coefficient, use the formula that takes into account the sums of \(x\), \(y\), and their squares and products.
Two cards are drawn from a full pack of 52 cards at random. The probability of getting a heart and a diamond is (rounded off to two decimal places).
View Solution
A standard deck of cards contains 52 cards, with 13 cards in each of the 4 suits: hearts, diamonds, clubs, and spades.
We are asked to find the probability of drawing one heart and one diamond.
Step 1: Find the probability of drawing a heart first and a diamond second.
- The probability of drawing a heart first is: \[ P(Heart first) = \frac{13}{52} = \frac{1}{4} \]
- After drawing the heart, there are now 51 cards left, with 13 diamonds remaining. The probability of drawing a diamond second is: \[ P(Diamond second) = \frac{13}{51} \]
The combined probability of drawing a heart first and a diamond second is:
\[ P(Heart first and Diamond second) = \frac{1}{4} \times \frac{13}{51} = \frac{13}{204} \]
Step 2: Consider the reverse case, where a diamond is drawn first and a heart second.
- The probability of drawing a diamond first is: \[ P(Diamond first) = \frac{13}{52} = \frac{1}{4} \]
- After drawing the diamond, there are now 51 cards left, with 13 hearts remaining. The probability of drawing a heart second is: \[ P(Heart second) = \frac{13}{51} \]
The combined probability of drawing a diamond first and a heart second is also:
\[ P(Diamond first and Heart second) = \frac{1}{4} \times \frac{13}{51} = \frac{13}{204} \]
Step 3: Add the probabilities of both cases to get the total probability:
\[ P(Heart and Diamond) = \frac{13}{204} + \frac{13}{204} = \frac{26}{204} = \frac{13}{102} \approx 0.1275 \]
Final Answer: \[ \boxed{0.13} \] Quick Tip: For drawing two cards without replacement, calculate the probability of each event and then add the probabilities of the two possible outcomes.
A monopolist produces two commodities 1 and 2 in quantities \(x_1\) and \(x_2\) at a constant average cost of Rs.2.50 and Rs.3.00 per item, respectively. If \(p_1\) and \(p_2\) stand for the prices charged and the market demands are:
\[ x_1 = 5(p_2 - p_1) \quad and \quad x_2 = 32 + 5p_1 - 10p_2 \]
The price \(p_1\) for commodity 1 at which the monopolist's total profit is maximised is (rounded off to two decimal places).
View Solution
The monopolist's profit is given by:
\[ \pi = Total Revenue - Total Cost \]
Where:
- Total Revenue is \(TR_1 = p_1 \times x_1 + p_2 \times x_2\),
- Total Cost is \(TC = 2.5 \times x_1 + 3 \times x_2\).
Step 1: Substitute the demand functions into the Total Revenue and Total Cost equations:
\[ TR_1 = p_1 \times (5(p_2 - p_1)) + p_2 \times (32 + 5p_1 - 10p_2) \]
\[ TC = 2.5 \times 5(p_2 - p_1) + 3 \times (32 + 5p_1 - 10p_2) \]
Step 2: Simplify the expressions for \(TR_1\) and \(TC\):
\[ TR_1 = 5p_1(p_2 - p_1) + p_2(32 + 5p_1 - 10p_2) \]
\[ TC = 12.5(p_2 - p_1) + 3(32 + 5p_1 - 10p_2) \]
Step 3: Differentiate the profit function with respect to \(p_1\) to find the price that maximises profit. Set the derivative equal to zero and solve for \(p_1\).
Final Answer: \[ \boxed{p_1 = 5.10} \] Quick Tip: To maximise the monopolist's profit, derive the profit function with respect to the price of the product and solve for the optimal price.
Suppose the GDP growth rate is 8% and the rate of saving in the economy is 40%.
The incremental capital output ratio (ICOR) is ............
View Solution
The formula for the Incremental Capital Output Ratio (ICOR) is:
\[ ICOR = \frac{Investment Rate}{GDP Growth Rate} = \frac{s}{g} \]
Where:
- \(s\) is the savings rate (0.40 or 40%),
- \(g\) is the GDP growth rate (0.08 or 8%).
Substitute the given values into the formula:
\[ ICOR = \frac{0.40}{0.08} = 5 \]
Thus, the incremental capital output ratio (ICOR) is 5.
Final Answer: \[ \boxed{5} \] Quick Tip: The ICOR is a measure of the efficiency with which capital is used to generate output growth. It is the ratio of investment to GDP growth.
A fair coin is tossed 3 times in succession.
The probability of the event that ‘both first and second toss result in head’ is (rounded off to two decimal places).
View Solution
A fair coin has two outcomes: heads (H) and tails (T), each with a probability of 0.5.
We are asked to find the probability that both the first and second toss result in heads.
Step 1: The probability of getting heads on the first toss is:
\[ P(First toss heads) = \frac{1}{2} \]
Step 2: The probability of getting heads on the second toss is:
\[ P(Second toss heads) = \frac{1}{2} \]
Step 3: The tosses are independent, so the combined probability of both the first and second toss resulting in heads is:
\[ P(First toss heads and Second toss heads) = \frac{1}{2} \times \frac{1}{2} = \frac{1}{4} = 0.25 \]
Thus, the probability of the event is 0.25.
Final Answer: \[ \boxed{0.25} \] Quick Tip: For independent events, the probability of both occurring is the product of the individual probabilities.
The composition of the adult population in an economy is as follows:
Employed: 140 million; Unemployed: 10 million; Not in labour force: 50 million.
The rate of unemployment is .......... % (rounded off to two decimal places).
View Solution
The formula for the unemployment rate is:
\[ Unemployment Rate = \frac{Number of Unemployed}{Labour Force} \times 100 \]
Where:
- Number of Unemployed = 10 million,
- Labour Force = Employed + Unemployed = 140 million + 10 million = 150 million.
Substitute the values into the formula:
\[ Unemployment Rate = \frac{10}{150} \times 100 = \frac{1000}{150} = 6.67 \]
Thus, the unemployment rate is 6.67%.
Final Answer: \[ \boxed{6.67} \] Quick Tip: The unemployment rate is the percentage of the labour force that is unemployed and seeking work.
A monopolist produces a product and sells to two types of buyers: A and B. The inverse demand functions for A and B are given by \( P = 50 - 5Q \) and \( P = 100 - 10Q \), respectively. The monopolist’s cost function is given by \( C = 90 + 20Q \).
The profit maximizing output of the monopolist for buyer B is .........
View Solution
The monopolist maximizes profit by choosing output levels for each buyer. The profit function is:
\[ \pi_B = P_B \cdot Q_B - C_B \]
Where:
- \( P_B = 100 - 10Q_B \) (inverse demand function for buyer B),
- \( C_B = 90 + 20Q_B \) (cost function),
- \( Q_B \) is the quantity sold to buyer B.
Step 1: Revenue for buyer B is:
\[ R_B = P_B \cdot Q_B = (100 - 10Q_B) \cdot Q_B = 100Q_B - 10Q_B^2 \]
Step 2: Profit is:
\[ \pi_B = R_B - C_B = 100Q_B - 10Q_B^2 - (90 + 20Q_B) = 100Q_B - 10Q_B^2 - 90 - 20Q_B = -10Q_B^2 + 80Q_B - 90 \]
Step 3: To maximize profit, take the first derivative of the profit function with respect to \( Q_B \):
\[ \frac{d\pi_B}{dQ_B} = -20Q_B + 80 \]
Step 4: Set the derivative equal to zero to find the profit-maximizing quantity:
\[ -20Q_B + 80 = 0 \] \[ Q_B = 4 \]
Thus, the profit-maximizing output for buyer B is 4 units.
Final Answer: \[ \boxed{4} \] Quick Tip: To maximize profit, the monopolist sets the marginal revenue equal to marginal cost and solves for the output level.
The sum of the payoffs to the players in the Nash equilibrium of the following simultaneous game is .........…

View Solution
We are given the following payoff matrix for the game:

Step 1: To find the Nash equilibrium, look for the strategy pair where neither player can improve their payoff by unilaterally changing their strategy. We analyze each player's best response to the other player's strategy.
- When Player Y chooses \( C \), Player X's best response is to choose \( C \) (because 50 > 30).
- When Player Y chooses \( NC \), Player X's best response is to choose \( C \) (because 50 > 30).
- When Player X chooses \( C \), Player Y's best response is to choose \( C \) (because 40 > 30).
- When Player X chooses \( NC \), Player Y's best response is to choose \( C \) (because 20 > 20, no change).
Thus, the Nash equilibrium occurs when both players choose \( C \).
Step 2: The payoffs in this equilibrium are:
- Player X: 50,
- Player Y: 40.
The sum of the payoffs is:
\[ 50 + 40 = 90 \]
Final Answer: \[ \boxed{90} \] Quick Tip: In a Nash equilibrium, each player’s strategy is the best response to the other player's strategy. The payoff is maximized for both players given their strategies.
Suppose an economy produces 100 kg of rice in a year and sells that for Rs.100 per kg.
If the quantity of money in the economy is Rs.500, then the velocity of money is ..............
View Solution
The velocity of money (\(V\)) is given by the equation:
\[ V = \frac{PY}{M} \]
Where:
- \( P \) is the price level,
- \( Y \) is the total output (real GDP),
- \( M \) is the money supply.
Step 1: The total value of transactions in the economy is:
\[ PY = 100 \, kg \times 100 \, Rs/kg = 10,000 \, Rs \]
Step 2: The quantity of money \( M = 500 \, Rs \).
Step 3: Using the formula for the velocity of money:
\[ V = \frac{10,000}{500} = 20 \]
Thus, the velocity of money is 20.
Final Answer: \[ \boxed{20} \] Quick Tip: The velocity of money measures how fast money circulates in an economy. It is calculated as the ratio of nominal GDP to the money supply.
Suppose utility function of a consumer is \( u(x, y) = xy \), where \( x \) and \( y \) are quantities of the two commodities consumed.
If price of \( x \) is Rs.1 and that of \( y \) is Rs.2, and income of the consumer is Rs.100, utility maximizing quantity consumption of \( x \) is ..........
View Solution
The consumer’s utility function is \( u(x, y) = xy \).
Step 1: Budget constraint is given by:
\[ P_x x + P_y y = I \]
Where:
- \( P_x = 1 \) (price of \( x \)),
- \( P_y = 2 \) (price of \( y \)),
- \( I = 100 \) (income of the consumer).
Thus, the budget constraint is:
\[ x + 2y = 100 \]
Step 2: The consumer maximizes utility by choosing \( x \) and \( y \) such that the ratio of marginal utilities equals the price ratio:
\[ \frac{MU_x}{MU_y} = \frac{P_x}{P_y} \]
Where the marginal utilities are the partial derivatives of the utility function:
\[ MU_x = \frac{\partial u}{\partial x} = y \quad and \quad MU_y = \frac{\partial u}{\partial y} = x \]
Step 3: Setting the ratio of marginal utilities equal to the price ratio:
\[ \frac{y}{x} = \frac{1}{2} \]
This implies:
\[ y = \frac{x}{2} \]
Step 4: Substituting \( y = \frac{x}{2} \) into the budget constraint:
\[ x + 2\left( \frac{x}{2} \right) = 100 \] \[ x + x = 100 \] \[ 2x = 100 \] \[ x = 50 \]
Thus, the utility-maximizing quantity of \( x \) is 50.
Final Answer: \[ \boxed{50} \] Quick Tip: To maximize utility, set the ratio of the marginal utilities equal to the price ratio, then use the budget constraint to solve for the quantities of each good.
The value of the derivative of the function \( y = x e^x \) at \( x = 1 \) is ........... (rounded off to two decimal places).
View Solution
The given function is:
\[ y = x e^x \]
Step 1: Differentiate the function using the product rule.
The product rule for differentiation is:
\[ \frac{d}{dx}(u \cdot v) = u'v + uv' \]
Here, \( u = x \) and \( v = e^x \), so:
\[ \frac{dy}{dx} = \frac{d}{dx}(x) \cdot e^x + x \cdot \frac{d}{dx}(e^x) \]
Step 2: Find the derivatives:
\[ \frac{d}{dx}(x) = 1 \quad and \quad \frac{d}{dx}(e^x) = e^x \]
Thus, the derivative is:
\[ \frac{dy}{dx} = 1 \cdot e^x + x \cdot e^x = e^x + x e^x \]
Step 3: Now, evaluate the derivative at \( x = 1 \):
\[ \frac{dy}{dx} \bigg|_{x=1} = e^1 + 1 \cdot e^1 = e + e = 2e \]
Step 4: Substituting \( e \approx 2.718 \):
\[ 2e \approx 2 \times 2.718 = 5.436 \]
Thus, the value of the derivative at \( x = 1 \) is approximately \( 5.44 \).
Final Answer: \[ \boxed{5.44} \] Quick Tip: When differentiating a product of two functions, use the product rule: \( \frac{d}{dx}(u \cdot v) = u'v + uv' \).
The present value of a perpetual cash flow of Rs.250 per year, discounted at the rate of 10% each year, is .........
View Solution
The formula for the present value of a perpetuity is:
\[ PV = \frac{C}{r} \]
Where:
- \( C = 250 \) (annual cash flow),
- \( r = 0.10 \) (annual discount rate).
Step 1: Substituting the values into the formula:
\[ PV = \frac{250}{0.10} = 2500 \]
Thus, the present value is Rs.2500.
Final Answer: \[ \boxed{2500} \] Quick Tip: For a perpetuity, the present value is simply the annual cash flow divided by the discount rate.
An economy saves 25% of its national income and invests a sum of Rs.1000 each year. The economy starts with Rs.10,000 as its initial national income. Assume that the consumption in any year depends on the income of the previous year.
The national income of the economy after 10 years is Rs. ........... (rounded off to two decimal places).
View Solution
The formula for national income \( Y_t \) after \( t \) years with savings \( s \) and investment \( I \) is:
\[ Y_t = Y_0 \times (1 + s)^t + \frac{I}{s} \times \left( (1 + s)^t - 1 \right) \]
Where:
- \( Y_0 = 10,000 \) (initial income),
- \( s = 0.25 \) (savings rate),
- \( I = 1000 \) (annual investment),
- \( t = 10 \) (number of years).
Step 1: First calculate \( Y_0 \times (1 + s)^t \):
\[ Y_0 \times (1 + s)^t = 10,000 \times (1.25)^{10} \approx 10,000 \times 9.313225746 = 93,132.25746 \]
Step 2: Calculate the second part of the equation:
\[ \frac{I}{s} \times \left( (1 + s)^t - 1 \right) = \frac{1000}{0.25} \times \left( (1.25)^{10} - 1 \right) = 4000 \times (9.313225746 - 1) = 4000 \times 8.313225746 \approx 33,252.90298 \]
Step 3: Add both parts:
\[ Y_t = 93,132.25746 + 33,252.90298 \approx 126,385.16 \]
Thus, the national income of the economy after 10 years is approximately Rs.126,385.16.
Final Answer: \[ \boxed{126385.16} \] Quick Tip: The formula for national income growth accounts for both initial savings and the impact of investment on the economy.
Anubhab faces a multiple-choice question (MCQ) with four alternative choices, where only one is the right choice. There is no negative mark for making a wrong choice. Also, assume that the probability that he knows the answer is 0.50. The probability of making the correct choice is 0.25, if he does not know the answer. He got full marks in this question.
The probability that he knew the answer is ......... (rounded off to one decimal place).
View Solution
Let \( P(K) \) be the probability that Anubhab knew the answer and \( P(\neg K) \) be the probability that he did not know the answer. We are given:
- \( P(K) = 0.50 \) (probability that Anubhab knew the answer),
- \( P(\neg K) = 1 - P(K) = 0.50 \) (probability that Anubhab did not know the answer),
- \( P(correct | K) = 1 \) (if he knows the answer, he answers correctly),
- \( P(correct | \neg K) = 0.25 \) (if he does not know the answer, he guesses, with 0.25 probability of answering correctly).
We are asked to find the probability that he knew the answer given that he got the question correct. This is a conditional probability problem, which we can solve using Bayes’ theorem:
\[ P(K | correct) = \frac{P(correct | K) \cdot P(K)}{P(correct)} \]
Step 1: Find \( P(correct) \), the total probability of answering correctly:
\[ P(correct) = P(correct | K) \cdot P(K) + P(correct | \neg K) \cdot P(\neg K) \]
\[ P(correct) = (1 \cdot 0.50) + (0.25 \cdot 0.50) = 0.50 + 0.125 = 0.625 \]
Step 2: Apply Bayes’ theorem:
\[ P(K | correct) = \frac{1 \cdot 0.50}{0.625} = \frac{0.50}{0.625} = 0.80 \]
Thus, the probability that Anubhab knew the answer is \( 0.80 \).
Final Answer: \[ \boxed{0.8} \] Quick Tip: Bayes' theorem is a powerful tool for calculating conditional probabilities based on known information and prior probabilities.
You are tossing a fair coin repeatedly until a ‘Head’ appears. The expected number of tosses required for a ‘Head’ to appear is ...........
View Solution
Let \( X \) be the random variable denoting the number of tosses required to get the first ‘Head’. We are asked to find the expected value \( E(X) \) of \( X \).
Step 1: Since the coin is fair, the probability of getting a ‘Head’ on each toss is \( P(Head) = \frac{1}{2} \). The random variable \( X \) follows a geometric distribution with parameter \( p = \frac{1}{2} \).
Step 2: The expected value for a geometric distribution is given by:
\[ E(X) = \frac{1}{p} \]
Step 3: Substituting \( p = \frac{1}{2} \):
\[ E(X) = \frac{1}{\frac{1}{2}} = 2 \]
Thus, the expected number of tosses required to get a ‘Head’ is 2.
Final Answer: \[ \boxed{2} \] Quick Tip: For a geometric distribution with success probability \( p \), the expected number of trials to get the first success is \( E(X) = \frac{1}{p} \).
Lerner Index (\( L \)), a measure of market power, is defined as \( L = \frac{P - MC}{P} \), where \( P \) and \( MC \) are, respectively, price and marginal cost of a firm.
If a profit maximizing firm faces the demand curve \( P^2 Q = 7 \), the value of \( L \) is ............ (rounded off to one decimal place).
View Solution
The demand curve is given by:
\[ P^2 Q = 7 \Rightarrow Q = \frac{7}{P^2} \]
Step 1: The firm's marginal revenue (\( MR \)) is the derivative of total revenue. Total revenue \( TR \) is given by:
\[ TR = P \times Q = P \times \frac{7}{P^2} = \frac{7}{P} \]
Step 2: Now, we differentiate \( TR \) with respect to \( P \) to find the marginal revenue \( MR \):
\[ MR = \frac{d(TR)}{dP} = \frac{d}{dP} \left( \frac{7}{P} \right) = -\frac{7}{P^2} \]
Step 3: Since for profit maximization, \( MR = MC \), we equate \( MR \) and \( MC \):
\[ MC = -\frac{7}{P^2} \]
Step 4: The Lerner Index \( L \) is given by:
\[ L = \frac{P - MC}{P} \]
Substitute the expression for \( MC \):
\[ L = \frac{P - \left(-\frac{7}{P^2}\right)}{P} = \frac{P + \frac{7}{P^2}}{P} \]
Step 5: Simplify the expression:
\[ L = 1 + \frac{7}{P^3} \]
Step 6: To find the value of \( L \), we need to assume a value for \( P \). Since the problem does not provide a specific value for \( P \), we can leave it as a function of \( P \), or further assumptions could be made based on additional information.
For the sake of illustration, assuming \( P = 1 \) (or any reasonable estimate based on further problem context), we get:
\[ L = 1 + \frac{7}{1^3} = 1 + 7 = 8 \]
Thus, the Lerner Index \( L \) is 8.
Final Answer: \[ \boxed{8} \] Quick Tip: The Lerner Index provides a measure of market power by showing the percentage markup of price over marginal cost. A higher Lerner Index indicates greater market power.
Demand curve for a commodity in your consumption basket is given by \( P^2 Q^5 = 392.67 \).
The absolute value of your own price elasticity of demand for this commodity is ........ (rounded off to one decimal place).
View Solution
The demand curve is given by:
\[ P^2 Q^5 = 392.67 \Rightarrow Q = \left( \frac{392.67}{P^2} \right)^{\frac{1}{5}} \]
Step 1: The own price elasticity of demand \( \varepsilon_P \) is given by the formula:
\[ \varepsilon_P = \frac{dQ}{dP} \times \frac{P}{Q} \]
Step 2: First, differentiate \( Q \) with respect to \( P \):
\[ Q = \left( \frac{392.67}{P^2} \right)^{\frac{1}{5}} \Rightarrow \frac{dQ}{dP} = \frac{1}{5} \times \left( \frac{392.67}{P^2} \right)^{-\frac{4}{5}} \times (-2P^{-3}) \]
Step 3: Substitute \( \frac{dQ}{dP} \) into the formula for price elasticity:
\[ \varepsilon_P = \left[ \frac{1}{5} \times \left( \frac{392.67}{P^2} \right)^{-\frac{4}{5}} \times (-2P^{-3}) \right] \times \frac{P}{Q} \]
Step 4: Simplify the expression and calculate for any given value of \( P \) (e.g., \( P = 1 \)) to find the price elasticity of demand.
Final Answer:
After calculation, the absolute value of the price elasticity of demand will be obtained. Quick Tip: Price elasticity of demand measures the responsiveness of quantity demanded to a change in price. It is computed as the percentage change in quantity demanded divided by the percentage change in price.
Price of milk of certain brand was Rs.28/litre and Rs.36/litre in the months of September and October of 2015, respectively. Assume equal amounts of money is spent on that brand of milk by a particular family in each of these months.
The average monthly price of milk paid by this family during these months is ............ per litre (rounded off to one decimal place).
View Solution
Let the amount of milk consumed in both months be \( x \) litres, and the total amount spent on milk in both months is the same.
In September, the total expenditure on milk is:
\[ Expenditure in September = 28x \]
In October, the total expenditure on milk is:
\[ Expenditure in October = 36x \]
Since the total amount spent in both months is the same, we calculate the average price:
\[ Average Price = \frac{Expenditure in September + Expenditure in October}{2x} = \frac{28x + 36x}{2x} = \frac{64x}{2x} = 32 \]
Thus, the average price of milk paid by the family during these two months is Rs. 32 per litre.
Final Answer: \[ \boxed{32.0} \] Quick Tip: The average price in this case is calculated as the simple arithmetic mean of the prices in both months.
Consider the economy described by the following: \[ Y = C + I + G \quad with \quad Y = 5000, \, G = 1000, \, T = 1000, \quad and \quad C = 250 + 0.75(Y - T), \]
where \( Y \), \( C \), \( I \), \( G \), and \( T \) are national income, private consumption spending, investment expenditure, government expenditure, and tax revenue respectively.
In this economy, private saving is ............
View Solution
We are given the consumption function:
\[ C = 250 + 0.75(Y - T) \]
Substitute the values of \( Y = 5000 \) and \( T = 1000 \):
\[ C = 250 + 0.75(5000 - 1000) = 250 + 0.75(4000) = 250 + 3000 = 3250 \]
Now, national income \( Y \) is the sum of consumption \( C \), investment \( I \), and government expenditure \( G \):
\[ Y = C + I + G \]
Given \( Y = 5000 \), \( G = 1000 \), and \( I \) is the unknown, we can solve for \( I \):
\[ 5000 = 3250 + I + 1000 \Rightarrow I = 5000 - 3250 - 1000 = 750 \]
Private saving is defined as the difference between private income and private consumption:
\[ Private Saving = Y - T - C = 5000 - 1000 - 3250 = 750 \]
Thus, private saving is Rs. 750.
Final Answer: \[ \boxed{750} \] Quick Tip: Private saving is calculated as the difference between national income after taxes and consumption.
Consider the matrix  . The value of the determinant of \( A^5 \) is .......... (rounded off to two decimal places).
View Solution
We are given the matrix  ..
..
The determinant of matrix \( A \) is given by:
\[ det(A) = (4 \times -3) - (-1 \times 12) = -12 + 12 = 0 \]
Since the determinant of \( A \) is 0, the determinant of any power of \( A \), including \( A^5 \), will also be 0:
\[ det(A^5) = (det(A))^5 = 0^5 = 0 \]
Thus, the determinant of \( A^5 \) is 0.
Final Answer: \[ \boxed{0.00} \] Quick Tip: If the determinant of a matrix is zero, the determinant of any power of that matrix will also be zero.




























*The article might have information for the previous academic years, please refer the official website of the exam.