
GATE 2023 Question Paper with Answer Key PDF for Ecology and Evolution (February 11 Afternoon Session)
- Chemistry Syllabus
- Maths Syllabus
- Physics Syllabus
- Exam Pattern
- Paper Analysis
- Chemical Engg Syllabus
- Civil Engg Syllabus
- ECE Syllabus
- Mechanical Engg Syllabus
- Engg Science Syllabus
- Mining Engg Syllabus
- IN Syllabus
- CSE Syllabus
- EE Syllabus
- AE Syllabus
- BM Syllabus
- GG Syllabus
- EY Syllabus
- ST Syllabus
- TF Syllaus
- AR Syllabus
- XL Syllabus
- MT Syllabus
- PI Syllabus
- PE Syllabus
- ME Pattern
- TF Pattern
- CE Pattern
- EE Pattern
- EC Pattern
- CS Pattern
- BT Pattern
- BM Pattern
- IN Pattern
- DA Syllabus
- NA & ME Syallabus
- ES & Engg Syllabus
- Geomatics Engg Syllabus
- Agri Engg Syllabus
- Humanities and Social Sci
- PI Syllabus


Content Curator | Updated On - Dec 1, 2025
GATE Question Papers are the most important study material for effective exam preparation. We at Zollege have provided all GATE Previous Year Papers with Solution PDFs here. GATE 2023 Ecology and Evolution exam was conducted successfully on February 11 by Indian Institute of Technology Kanpur.
Students can freely download the GATE previous year's question paper PDFs along with their solutions here.We strongly encourage GATE aspirants to scan through all the GATE Question Paper to know the overall difficulty level,GATE Syllabus and understand the changes in GATE Exam Pattern over the years.
GATE 2023 Ecology and Evolution Question Paper with Answer Key PDF Afternoon Session
| GATE 2023 Ecology and Evolution Question Paper PDF | GATE 2023 Ecology and Evolution Answer Key PDF | GATE 2023 Ecology and Evolution Solution PDF |
|---|---|---|
| Download PDF | Download PDF | Check Solutions |

"You are delaying the completion of the task. Send __________ contributions at the earliest."
View Solution
The sentence requires a word to indicate possession of the noun "contributions".
The blank must be filled by a possessive adjective.
Let's analyze the options:
(A) "you are" is a pronoun followed by a verb, not a possessive adjective.
(B) "your" is the possessive adjective for "you", indicating that the contributions belong to the person being addressed. This fits the sentence grammatically.
(C) "you're" is a contraction of "you are". Like option (A), it is grammatically incorrect in this context.
(D) "yore" is a noun or adverb referring to a time in the distant past, which is irrelevant to the sentence's meaning.
Therefore, "your" is the correct word to use.
Quick Tip: To distinguish between "your" and "you're", try replacing the word with "you are". If the sentence still makes sense, "you're" is correct. If not, "your" is the correct choice. For example, "Send you are contributions..." does not make sense.
References : __________ :: Guidelines : Implement
(By word meaning)
View Solution
This is a word analogy problem. We need to identify the relationship in the second pair and find a word for the first pair that completes a similar relationship.
The relationship in "Guidelines : Implement" is that one performs an action (Implement) based on a set of rules or information (Guidelines). You implement guidelines.
Similarly, for "References : _____", we need an action that one performs with references.
(A) Sight means to see. This is not the primary action associated with academic references.
(B) Site refers to a location. It is a noun and does not fit the action-based relationship.
(C) Cite means to refer to a source of information to support a point. One cites references. This perfectly matches the relationship.
(D) Plagiarise is an improper action related to using sources, not the standard, expected action like "implement".
Thus, the correct analogy is References : Cite :: Guidelines : Implement.
Quick Tip: In verbal analogies, first determine the relationship between the given pair of words (e.g., cause-effect, action-object, part-whole). Then, apply that same relationship to the first word of the second pair to find the missing word.
In the given figure, PQRS is a parallelogram with PS = 7 cm, PT = 4 cm and PV = 5 cm. What is the length of RS in cm? (The diagram is representative.)

\
View Solution
The formula for the area of a parallelogram is Base \(\times\) Height.
The area of the parallelogram PQRS can be calculated in two ways using the given information.
Method 1: Using base QR and height PT.
In a parallelogram, opposite sides are equal, so QR = PS = 7 cm.
The height corresponding to base QR is PT = 4 cm.
Area = QR \(\times\) PT = 7 cm \(\times\) 4 cm = 28 cm\(^2\).
Method 2: Using base RS and height PV.
The height corresponding to base RS is PV = 5 cm.
Area = RS \(\times\) PV = RS \(\times\) 5 cm.
Since the area of the parallelogram is the same regardless of which base and corresponding height are used, we can equate the two expressions for the area.
RS \(\times\) 5 = 28
Solving for the length of RS:
RS = \(\frac{28}{5}\) cm.
Quick Tip: Remember that the area of a parallelogram is constant. If you are given two different heights corresponding to two different bases, you can set up an equation: Base\(_1\) \(\times\) Height\(_1\) = Base\(_2\) \(\times\) Height\(_2\).
In 2022, June Huh was awarded the Fields medal, which is the highest prize in Mathematics.
When he was younger, he was also a poet. He did not win any medals in the International Mathematics Olympiads. He dropped out of college.
Based only on the above information, which one of the following statements can be logically inferred with certainty?
View Solution
The question requires an inference that must be true based only on the provided text about June Huh.
(A) This statement is false. The text explicitly says June Huh, a Fields medalist, "did not win any medals in the International Mathematics Olympiads." This is a direct contradiction.
(B) This is a hasty generalization. The text gives one example of someone who dropped out of college and won the Fields medal. We cannot conclude this is true for "everyone".
(C) This is also a hasty generalization. We only know that one Fields medalist, June Huh, was a poet. We cannot conclude that "all" Fields medalists are poets.
(D) The word "some" means "at least one". The text provides a concrete example of a Fields medalist (June Huh) who "dropped out of college". Therefore, it is certain that at least one, or "some", Fields medalists have dropped out of college.
Quick Tip: In logic questions, be wary of absolute terms like "all", "every", or "none". These can be disproven by a single counterexample. Statements with "some" or "at least one" only require a single example to be proven true.
A line of symmetry is defined as a line that divides a figure into two parts in a way such that each part is a mirror image of the other part about that line.
The given figure consists of 16 unit squares arranged as shown. In addition to the three black squares, what is the minimum number of squares that must be coloured black, such that both PQ and MN form lines of symmetry? (The figure is representative)

View Solution
This problem asks for the minimum number of additional squares to be colored to make the pattern symmetric. This can be interpreted as finding all the unique reflections of the original squares across both lines of symmetry.
Let's use coordinates (row, column) for the squares, with (1,1) at the top left.
The initial three black squares are at S\(_1\)=(2,2), S\(_2\)=(3,1), and S\(_3\)=(4,3).
Let's find the reflections of these initial squares across both lines.
Reflection across the vertical line PQ: A square at (r, c) is reflected to (r, 5-c).
- Reflection of S\(_1\)(2,2) across PQ is (2, 5-2) = (2,3).
- Reflection of S\(_2\)(3,1) across PQ is (3, 5-1) = (3,4).
- Reflection of S\(_3\)(4,3) across PQ is (4, 5-3) = (4,2).
Reflection across the diagonal line MN: A square at (r, c) is reflected to (5-c, 5-r).
- Reflection of S\(_1\)(2,2) across MN is (5-2, 5-2) = (3,3).
- Reflection of S\(_2\)(3,1) across MN is (5-1, 5-3) = (4,2).
- Reflection of S\(_3\)(4,3) across MN is (5-3, 5-4) = (2,1).
Now, let's list all the unique new squares that must be colored black.
The set of required new squares is the union of the reflections:
{ (2,3), (3,4), (4,2) \(\cup\) { (3,3), (4,2), (2,1) .
The unique squares in this combined set are: (2,3), (3,4), (4,2), (3,3), and (2,1).
Counting these unique squares, we get a total of 5.
Therefore, a minimum of 5 additional squares must be colored black.
Quick Tip: For symmetry problems on a grid, first determine the rules for reflection for each line of symmetry. Then, apply these rules to each of the initial points to find the set of points required by symmetry. Finally, count the number of unique new points.
Human beings are one among many creatures that inhabit an imagined world. In this imagined world, some creatures are cruel. If in this imagined world, it is given that the statement "Some human beings are not cruel creatures" is FALSE, then which of the following set of statement(s) can be logically inferred with certainty?
(i) All human beings are cruel creatures.
(ii) Some human beings are cruel creatures.
(iii) Some creatures that are cruel are human beings.
(iv) No human beings are cruel creatures.
View Solution
The given premise is that the statement "Some human beings are not cruel creatures" is FALSE.
In formal logic, the negation of "Some A are not B" is "All A are B".
Therefore, if "Some human beings are not cruel creatures" is FALSE, its negation must be TRUE.
The negation is "All human beings are cruel creatures".
Let's evaluate the given statements based on this conclusion:
(i) "All human beings are cruel creatures." - This is TRUE, as it is the direct logical conclusion from the premise.
(ii) "Some human beings are cruel creatures." - If ALL human beings are cruel creatures (and assuming the set of human beings is not empty), it logically follows that at least some of them are. So, this is TRUE.
(iii) "Some creatures that are cruel are human beings." - This means "Some cruel creatures are human beings." Since all human beings are cruel creatures, the set of human beings is a subset of cruel creatures. Therefore, some cruel creatures are indeed human beings. This is TRUE.
(iv) "No human beings are cruel creatures." - This is the direct contradiction of statement (i). Since (i) is TRUE, (iv) must be FALSE.
Thus, the statements that can be inferred with certainty are (i), (ii), and (iii).
Quick Tip: Understanding the relationships between categorical propositions (All A are B, No A are B, Some A are B, Some A are not B) is key. Remember that "All A are B" implies "Some A are B", and the negation of "Some A are not B" is "All A are B".
To construct a wall, sand and cement are mixed in the ratio of 3:1. The cost of sand and that of cement are in the ratio of 1:2.
If the total cost of sand and cement to construct the wall is 1000 rupees, then what is the cost (in rupees) of cement used?
View Solution
Let the quantity of sand be 3x units and the quantity of cement be 1x unit, based on the mixing ratio 3:1.
Let the cost per unit of sand be 1y rupees and the cost per unit of cement be 2y rupees, based on the cost ratio 1:2.
Now, we can calculate the total cost for each material.
Total cost of sand = (Quantity of sand) \(\times\) (Cost per unit of sand) = (3x) \(\times\) (1y) = 3xy.
Total cost of cement = (Quantity of cement) \(\times\) (Cost per unit of cement) = (1x) \(\times\) (2y) = 2xy.
The ratio of the total cost of sand to the total cost of cement is 3xy : 2xy, which simplifies to 3:2.
The total cost for the wall is given as 1000 rupees. This cost is divided in the ratio 3:2 between sand and cement.
The sum of the parts in the cost ratio is 3 + 2 = 5 parts.
The value of one part is Total Cost / Total Parts = 1000 / 5 = 200 rupees.
The question asks for the cost of cement used.
Cost of cement = (Parts for cement) \(\times\) (Value of one part) = 2 \(\times\) 200 = 400 rupees.
Quick Tip: When dealing with multiple ratios, combine them to find the final ratio of interest. Here, combining the quantity ratio (3:1) and the unit cost ratio (1:2) gives the total cost ratio (3\(\times\)1 : 1\(\times\)2 = 3:2).
The World Bank has declared that it does not plan to offer new financing to Sri Lanka, which is battling its worst economic crisis in decades, until the country has an adequate macroeconomic policy framework in place. In a statement, the World Bank said Sri Lanka needed to adopt structural reforms that focus on economic stabilisation and tackle the root causes of its crisis. The latter has starved it of foreign exchange and led to shortages of food, fuel, and medicines. The bank is repurposing resources under existing loans to help alleviate shortages of essential items such as medicine, cooking gas, fertiliser, meals for children, and cash for vulnerable households.
Based only on the above passage, which one of the following statements can be inferred with certainty?
View Solution
The question asks for an inference that can be made with certainty based only on the given text.
The very first sentence states that the World Bank will not offer new financing "until the country has an adequate macroeconomic policy framework in place."
This conditional statement directly implies that, from the World Bank's perspective, the condition is not currently met. Therefore, Sri Lanka does not yet have an adequate framework.
Let's check the other options:
(A) The passage says the crisis has "starved it of foreign exchange", implying the lack of foreign exchange is a consequence or symptom of the crisis, not necessarily its root cause. The bank points to the need for "structural reforms" to tackle the root causes.
(B) The passage mentions what Sri Lanka needs to do, but it does not state that the World Bank will be the one to advise them on how to do it.
(D) This is incorrect. The passage states the bank is "repurposing resources under existing loans," not providing "additional funds".
Therefore, statement (C) is the only one that can be inferred with certainty.
Quick Tip: In reading comprehension, pay close attention to conditional statements ("if...then", "until", "unless"). These often provide the basis for the most certain logical inferences.
The coefficient of \(x^4\) in the polynomial \((x - 1)^3(x - 2)^3\) is equal to ________.
View Solution
To find the coefficient of \(x^4\), we can first expand each binomial term using the formula \((a-b)^3 = a^3 - 3a^2b + 3ab^2 - b^3\).
First term: \((x-1)^3 = x^3 - 3(x^2)(1) + 3(x)(1^2) - 1^3 = x^3 - 3x^2 + 3x - 1\).
Second term: \((x-2)^3 = x^3 - 3(x^2)(2) + 3(x)(2^2) - 2^3 = x^3 - 6x^2 + 12x - 8\).
Now, we need to multiply these two polynomials: \((x^3 - 3x^2 + 3x - 1)(x^3 - 6x^2 + 12x - 8)\).
We only need to find the combinations of terms whose product results in an \(x^4\) term.
1. (Term with \(x^3\) from the first polynomial) \(\times\) (Term with \(x\) from the second polynomial):
\((x^3) \times (12x) = 12x^4\). The coefficient is 12.
2. (Term with \(x^2\) from the first polynomial) \(\times\) (Term with \(x^2\) from the second polynomial):
\((-3x^2) \times (-6x^2) = 18x^4\). The coefficient is 18.
3. (Term with \(x\) from the first polynomial) \(\times\) (Term with \(x^3\) from the second polynomial):
\((3x) \times (x^3) = 3x^4\). The coefficient is 3.
The total coefficient of the \(x^4\) term is the sum of these individual coefficients.
Total Coefficient = 12 + 18 + 3 = 33.
Quick Tip: When finding the coefficient of a specific power of x in a product of polynomials, you don't need to perform the full expansion. Systematically identify all pairs of terms (one from each polynomial) that multiply to give the desired power of x and sum their coefficients.
Which one of the following shapes can be used to tile (completely cover by repeating) a flat plane, extending to infinity in all directions, without leaving any empty spaces in between them? The copies of the shape used to tile are identical and are not allowed to overlap.
View Solution
Tiling a plane, also known as tessellation, requires that the shapes fit together without any gaps or overlaps. At any vertex where multiple shapes meet, the sum of their interior angles must be exactly 360 degrees.
(A) Circles: When circles are packed together, they always leave curved, empty spaces between them. They cannot tile the plane.
(B) Regular octagon: The interior angle of a regular octagon is \(\frac{(8-2) \times 180^\circ}{8} = 135^\circ\). If we try to fit octagons around a point, \(360^\circ\) is not an integer multiple of \(135^\circ\) (\(360/135 \approx 2.67\)). This means they cannot meet at a vertex without leaving a gap.
(C) Regular pentagon: The interior angle of a regular pentagon is \(\frac{(5-2) \times 180^\circ}{5} = 108^\circ\). Similarly, \(360^\circ\) is not an integer multiple of \(108^\circ\) (\(360/108 \approx 3.33\)). They cannot tile the plane.
(D) Rhombus: A rhombus is a type of quadrilateral (and a parallelogram). Any quadrilateral can tile the plane because the sum of its interior angles is \(360^\circ\). You can always arrange four identical quadrilaterals around a point to perfectly fill the space. More simply, any parallelogram can tile the plane by simple translation.
Therefore, a rhombus can be used to tile a plane.
Quick Tip: For a regular polygon to tile the plane by itself, its interior angle must be a divisor of 360 degrees. The only regular polygons that satisfy this are the equilateral triangle (60\(^\circ\)), the square (90\(^\circ\)), and the regular hexagon (120\(^\circ\)). Any parallelogram, including a rhombus, can tile the plane.
Which one of the following is an example of mechanical potential energy?
View Solution
Mechanical potential energy is the energy stored in an object due to its position or physical configuration.
(A) An activated neuron involves an action potential, which is a form of electrochemical energy, not mechanical potential energy.
(B) A polarized cell membrane stores energy in an electrochemical gradient, known as membrane potential.
(C) A stretched tendon is under tension and has stored elastic potential energy due to its deformation. Elastic potential energy is a form of mechanical potential energy.
(D) A relaxed muscle is not in a state of deformation or tension and thus does not store significant mechanical potential energy.
Therefore, a stretched tendon is the correct example of mechanical potential energy.
Quick Tip: Mechanical potential energy comes in two main forms: gravitational potential energy (due to height) and elastic potential energy (due to stretching or compression). In biology, elastic potential energy is common in tissues like tendons and ligaments.
A research team studies the probability of crop damage by wild boar in crop fields. For each crop field sampled, they record '1' if damage was observed, and '0' if damage was not observed. Which one of the following distributions is most appropriate to analyse the probability of crop damage?
View Solution
The experiment has the following characteristics:
1. Each trial (sampling a crop field) has only two possible outcomes: damage ('1', success) or no damage ('0', failure).
2. The probability of success (damage) is assumed to be the same for each trial.
3. The trials are independent of each other.
4. There is a fixed number of trials (the total number of crop fields sampled).
A random variable that counts the number of successes in a fixed number of independent trials with two outcomes is described by the Binomial distribution.
The other distributions are not appropriate: Poisson is for count data over an interval, while Cauchy and Gamma are continuous distributions.
Quick Tip: Remember the key characteristics of a Binomial experiment (often remembered by the acronym BINS): Binary outcomes, Independent trials, Number of trials is fixed, and Same probability of success for each trial. If your data fits these criteria, the Binomial distribution is the correct choice.
To test whether body size differs between two populations of a field mouse species, a researcher measured 100 individuals in each population and calculated the statistic
\(\frac{\bar{X}_1 - \bar{X}_2}{S_p \sqrt{\frac{1}{n_1} + \frac{1}{n_2}}}\)
where \(\bar{X}_1\) and \(\bar{X}_2\) are the mean body sizes of the two populations, respectively, \(S_p\) is the pooled standard deviation, and \(n_1\) and \(n_2\) are the sample sizes for the two populations, respectively.
This statistic is used in the
View Solution
The statistic presented is used to compare the means of two independent samples.
Let's break down the formula:
- The numerator, \(\bar{X}_1 - \bar{X}_2\), is the difference between the two sample means.
- The denominator, \(S_p \sqrt{\frac{1}{n_1} + \frac{1}{n_2}}\), is the standard error of the difference between the two means, calculated using a pooled standard deviation (\(S_p\)).
This exact formula is the test statistic for an independent two-sample Student's t-test, which is used to determine if there is a significant difference between the means of two groups.
The other tests are used for different purposes:
- Chi-square test is for categorical data.
- Kruskal-Wallis and Mann-Whitney U tests are non-parametric alternatives to ANOVA and the t-test, respectively, used when assumptions of normality are not met. They operate on ranks, not the means themselves.
Quick Tip: Recognize the classic formulas for common statistical tests. The structure `(Difference of means) / (Standard error of the difference)` is the hallmark of a two-sample t-test.
Which one of the following ecological processes best explains the observation that seedling establishment increases with distance from the parent tree in a forest?
View Solution
The phenomenon described is a classic ecological pattern explained by the Janzen-Connell hypothesis.
Seedlings very close to their parent tree experience high mortality rates.
This mortality is caused by density-dependent factors that are concentrated near the parent tree.
These factors include competition for resources (light, water, nutrients) with the parent and other siblings, as well as increased pressure from specialized herbivores, pathogens, and seed predators that are attracted to the high density of seeds and seedlings.
Since these negative interactions are primarily between the parent tree and its own offspring, or among the offspring themselves, this is a form of competition within a species (intraspecific competition).
As distance from the parent tree increases, the density of its seeds and seedlings decreases, reducing this intraspecific competition and predation pressure, leading to higher survival.
Quick Tip: The Janzen-Connell hypothesis is a key concept explaining biodiversity maintenance in forests. It posits that species-specific enemies (predators, pathogens) prevent any single species from dominating by causing high mortality of offspring near the parent tree. This is a form of intraspecific competition.
In the early 20th century, which one of these scientists made fundamental contributions to both the fields of evolution and statistics?
View Solution
This question asks to identify a key figure who contributed significantly to both evolutionary biology and statistics.
(A) R. A. Fisher was a British polymath. He is known as a father of modern statistics, having developed concepts like Analysis of Variance (ANOVA), maximum likelihood estimation, and experimental design. He was also one of the three main architects of the modern evolutionary synthesis, which integrated Darwin's theory of evolution with Mendelian genetics.
(B) Niko Tinbergen was a pioneer in the field of ethology (animal behavior) and is famous for his "four questions". His work was primarily in evolution and behavior, not statistics.
(C) August Weismann was a 19th-century German biologist who proposed the germ plasm theory, distinguishing between germ cells and somatic cells. He was a major evolutionary thinker but not a statistician.
(D) Thomas Huxley, also in the 19th century, was known as "Darwin's Bulldog" for his strong advocacy of evolutionary theory. He was a comparative anatomist, not a statistician.
Therefore, R. A. Fisher is the correct answer.
Quick Tip: R. A. Fisher, J. B. S. Haldane, and Sewall Wright are considered the three founders of population genetics and the modern evolutionary synthesis. Fisher is uniquely distinguished among them for also being a foundational figure in the field of statistics.
The figure depicts how body temperature changes for two species (L and M) as a function of ambient temperature.
Which one of the following statements about how L and M regulate temperature is correct?

View Solution
The graph plots Body Temperature (y-axis) against Ambient Temperature (x-axis).
A homeotherm (or endotherm) is an organism that maintains a stable internal body temperature regardless of the external ambient temperature. On the graph, this would be represented by a horizontal line.
A poikilotherm (or ectotherm) is an organism whose internal body temperature varies considerably, often conforming to the ambient temperature. On the graph, this would be represented by a line with a positive slope, often close to a 1:1 relationship.
Observing the graph:
- Species L shows a nearly constant body temperature across the range of ambient temperatures. This is characteristic of a homeotherm.
- Species M shows a body temperature that increases as the ambient temperature increases. This is characteristic of a poikilotherm.
Therefore, L is a homeotherm and M is a poikilotherm.
Quick Tip: When interpreting graphs of thermoregulation, remember: Homeotherm = "same heat" = stable internal temperature (horizontal line). Poikilotherm = "varied heat" = variable internal temperature that tracks the environment (sloped line).
You are a deep-sea organism and your potential mates are several hundreds of kilometers away from you. Which one of the following kinds of mating signals is most likely to help them locate you?
View Solution
The key constraints are the environment (deep-sea) and the distance (hundreds of kilometers). We need a signal that travels effectively under these conditions.
(A) Display gestures: These are visual signals. The deep sea is dark, making visual signals ineffective over long distances.
(B) Electric pulses: These are used by some aquatic animals for communication and navigation, but their effective range is very short, typically a few meters at most.
(C) Body colouration: This is also a visual signal. Even with bioluminescence, it would not be visible from hundreds of kilometers away.
(D) Sounds: Sound travels exceptionally well in water, much faster and farther than in air. Low-frequency sounds, in particular, can travel for hundreds or even thousands of kilometers in the ocean. This makes sound the most suitable medium for long-distance communication in the deep sea.
Quick Tip: The effectiveness of a communication signal depends heavily on the physical properties of the environment. In water, sound is the superior long-range signal, while in open air, visual and sound signals can both be effective. In dense forests, sound often prevails over visual signals.
Which one of the following options represents the correct order with respect to levels of organization?
B - biomes; E - ecosystems; P - populations; I - individuals; C - communities
View Solution
The levels of ecological organization build upon one another in a specific hierarchy, from the smallest unit to the largest.
1. Individuals (I): A single organism.
2. Populations (P): A group of individuals of the same species living in the same area.
3. Communities (C): An assemblage of different populations (multiple species) living and interacting in the same area.
4. Ecosystems (E): A biological community of interacting organisms and their physical environment (abiotic factors).
5. Biomes (B): A large-scale community of flora and fauna occupying a major habitat, defined by climate and dominant vegetation (e.g., desert, tropical rainforest).
Arranging these in increasing order of complexity gives: Individuals < Populations < Communities < Ecosystems < Biomes.
This corresponds to the sequence I < P < C < E < B.
Quick Tip: Remember the ecological hierarchy: Individuals make up Populations. Multiple Populations make up a Community. A Community plus its abiotic environment is an Ecosystem. Major global Ecosystems are Biomes.
Which one of the following options describes the difference between abiotic resources and abiotic conditions?
View Solution
In ecology, abiotic factors are non-living components of an ecosystem. They are divided into resources and conditions.
Abiotic resources are substances or energy that are consumed by organisms, and their availability can be reduced by this consumption. Examples include water, mineral nutrients, light, and physical space.
Abiotic conditions are physical or chemical features of the environment that influence organisms but are not consumed by them. Examples include temperature, pH, salinity, and humidity.
Let's evaluate the options based on these definitions:
(A) Both resources (e.g., rainfall) and conditions (e.g., temperature) can fluctuate. This is incorrect.
(B) Same as (A), this is incorrect.
(C) This accurately states the fundamental difference. Resources like water are "used up" (consumed), while conditions like temperature are experienced but not consumed. This is correct.
(D) This reverses the correct definition.
Quick Tip: The key concept distinguishing resources from conditions is consumption. If an organism's activity can decrease the availability of an abiotic factor for other organisms, it is a resource. If not, it is a condition.
Which one of the following ranges correctly represents the percentage of energy that is transferred from a lower to the next higher trophic level in most terrestrial systems?
View Solution
The transfer of energy between trophic levels is known as trophic efficiency.
A large amount of energy is lost at each trophic level due to metabolic processes (respiration), and because not all organic matter from a lower level is consumed or assimilated by the higher level.
As a general rule of thumb, known as the "10 percent rule," only about 10% of the energy from one trophic level is incorporated into the biomass of the next higher level.
However, this is an average, and the actual efficiency can vary.
Let's examine the options in light of the 10% rule:
(A) 0.01% to 1% is generally too low for overall trophic transfer.
(B) 33% to 66% is far too high.
(C) 2% to 20% is a reasonable range that encompasses the typical average of 10%. This is the most plausible answer.
(D) 90% to 95% represents an extremely high, unrealistic level of efficiency.
Quick Tip: The "10 percent rule" of energy transfer between trophic levels is a fundamental concept in ecology. It explains why food chains are typically short and why biomass decreases at successively higher trophic levels. The most plausible answer for trophic efficiency will always be a range centered around 10%.
Whales and dolphins are hypothesized to have evolved along the northern shore of the Tethys Sea, prior to the Indian plate's collision with the Eurasian plate. To which one of the following animals are these aquatic mammals most closely related?
View Solution
Modern phylogenetic studies based on genetic evidence have placed cetaceans (whales and dolphins) within the order Artiodactyla (even-toed ungulates).
This means their closest living relatives are animals like hippos, deer, giraffes, and pigs.
Let's examine the options:
(A) Pigs are members of the order Artiodactyla.
(B) Elephants belong to the order Proboscidea.
(C) Seals are pinnipeds, belonging to the order Carnivora.
(D) Zebras belong to the order Perissodactyla (odd-toed ungulates).
Among the given choices, pigs are the only animals from the same order (Artiodactyla) as the ancestors of whales and dolphins, making them the most closely related. The closest living relative is the hippopotamus, but pigs are also close relatives within this group.
Quick Tip: Evolutionary relationships can be surprising. Remember that whales and dolphins evolved from land-dwelling, even-toed hoofed mammals (Artiodactyls). Their closest living relatives today are hippos, followed by other artiodactyls like pigs and deer.
Which one of the following options represents the correct order of decreasing average net primary productivity (g / m\(^2\) / year) in natural ecosystems?
View Solution
Net Primary Productivity (NPP) is the rate at which producers create biomass. It is generally highest in warm, wet climates and lowest in cold, dry climates.
Let's rank the given ecosystems from highest to lowest average NPP:
1. Tropical forests: Consistently high temperature, abundant rainfall, and high solar radiation lead to the highest NPP among major terrestrial biomes.
2. Swamps and marshes: These wetlands are also extremely productive due to high water and nutrient availability, often rivaling tropical forests. Some sources place them highest, but on a global average basis for large biomes, tropical forests are typically ranked first.
3. Temperate forests: Have moderate temperatures and rainfall, leading to high but seasonal productivity, lower than tropical systems.
4. Temperate grasslands: Have lower rainfall than forests, which limits plant growth and thus NPP.
5. Tundra: Characterized by very cold temperatures, a short growing season, and permafrost, leading to the lowest NPP among these options.
The correct decreasing order is therefore: Tropical forests > Swamps and marshes > Temperate forests > Temperate grasslands > Tundra. This matches option (D).
Quick Tip: A simple rule for ranking ecosystem productivity is to consider the two main limiting factors for plant growth: water and temperature. Ecosystems that are warm and wet (like tropical rainforests) are the most productive, while those that are cold and/or dry (like tundra and deserts) are the least productive.
The increase in mean global temperature since the industrial revolution falls in the range of
View Solution
The industrial revolution began in the mid-18th century, but significant greenhouse gas emissions started accelerating in the late 19th century.
Scientific bodies like the Intergovernmental Panel on Climate Change (IPCC) track the change in global mean temperature relative to a pre-industrial baseline (typically 1850-1900).
According to the latest reports from the IPCC and other climate science organizations, the global average temperature has increased by approximately 1.1 to 1.2 \(^\circ\)C above pre-industrial levels as of the early 2020s.
This value falls squarely within the range of 0.5 \(^\circ\)C to 2 \(^\circ\)C.
The other ranges are incorrect:
(A) 0 \(^\circ\)C to 0.5 \(^\circ\)C is an underestimate; this level was surpassed decades ago.
(C) 2 \(^\circ\)C to 5 \(^\circ\)C and (D) > 5 \(^\circ\)C are projections for future warming under high-emissions scenarios, not the warming that has already occurred.
Quick Tip: For general knowledge questions on climate change, remember the key figures. The current warming is about 1.2\(^\circ\)C. The international policy goals set in the Paris Agreement aim to limit total warming to well below 2\(^\circ\)C, and preferably to 1.5\(^\circ\)C, compared to pre-industrial levels.
Which one of the following endangered species has been the subject of a reintroduction plan in India?
View Solution
This question asks about a specific conservation action in India.
(A) The Rusty spotted cat is one of the world's smallest cats, found in India and Sri Lanka. It is a protected species, but not the subject of a major reintroduction plan.
(B) The Jungle cat is widespread in Asia and is listed as Least Concern by the IUCN; it does not require a reintroduction plan.
(C) The Asiatic cheetah became extinct in India in the early 1950s. In 2022, a high-profile project, "Project Cheetah," began, reintroducing African cheetahs to Kuno National Park in Madhya Pradesh with the long-term goal of establishing a viable population.
(D) The Jaguar is a large cat found only in the Americas. It has never existed in India and therefore cannot be "reintroduced".
Therefore, the cheetah is the correct answer.
Quick Tip: Keeping up with major conservation news is helpful for ecology exams. The Cheetah reintroduction in India has been a very prominent and widely discussed conservation project in recent years.
Compared with bony fish, many shark species show steeper population declines in response to heavy fishing pressure. Which one of the following options explains this?
View Solution
The question asks for the biological reason why shark populations are particularly vulnerable to overfishing. This relates to their life history strategy.
Many shark species are classic "K-strategists". Their life history traits include:
- Slow growth and late sexual maturity.
- Long lifespan.
- Low fecundity (producing a small number of offspring at a time).
- High investment in each offspring.
Because they reproduce so slowly, their populations cannot rebound quickly when a large number of adults are removed by fishing. The population's maximum rate of increase is very low.
Let's evaluate the options:
(A) Their danger to humans is irrelevant to their population's response to fishing pressure.
(B) Their ancient lineage does not explain their current vulnerability.
(C) Being long-lived and late-maturing are key K-selected traits that result in a low intrinsic rate of population growth, making them highly susceptible to over-harvesting. This is the correct explanation.
(D) This statement is false; many shark species are coastal. Even if it were true, it wouldn't be the primary reason for their vulnerability.
Quick Tip: Vulnerability to overexploitation is strongly linked to an organism's life history. Species that are K-selected (long-lived, slow to mature, few offspring), like sharks, whales, and elephants, are much more vulnerable than r-selected species (short-lived, fast to mature, many offspring), like most bony fish.
Which one or more of the following options describe(s) how ferns differ from angiosperms and gymnosperms?
View Solution
The question asks for a key difference between ferns (Pteridophytes) and seed plants (Spermatophytes, which include angiosperms and gymnosperms).
(A) Ferns lack a vascular system. This is incorrect. Ferns are vascular plants, possessing xylem and phloem.
(B) Ferns have separate haploid and diploid generations. This is correct. The life cycle of a fern (alternation of generations) involves a large, independent diploid sporophyte (the familiar fern plant) and a small, independent, free-living haploid gametophyte (the prothallus). In seed plants, the gametophyte generation is highly reduced and is dependent on the sporophyte (e.g., the pollen grain and the ovule).
(C) Ferns are pollinated by flies. This is incorrect. Ferns do not produce seeds or flowers and therefore do not undergo pollination. They reproduce via spores, and fertilization requires water for the flagellated sperm to swim to the egg.
(D) Ferns are known only from the fossil record. This is incorrect. Ferns are a large and diverse group of living (extant) plants.
Although the question asks for "one or more" options, only (B) is a correct statement describing a difference.
Quick Tip: A major evolutionary transition in plants was the shift from a life cycle with independent gametophytes (as in mosses and ferns) to one with a highly reduced, dependent gametophyte (as in seed plants). This is a key distinguishing feature between these groups.
The IUCN Red List is based on a set of criteria to evaluate species vulnerability to extinction. Which one or more of the options is/are used as criteria?
View Solution
The IUCN Red List of Threatened Species uses a quantitative set of criteria to assess the extinction risk of a species. These criteria fall into several categories.
(A) Absolute population size: This is a criterion. For example, a species can be listed as Critically Endangered if it has fewer than 50 mature individuals, or Endangered with fewer than 250. This is correct.
(B) Geographic range: This is a criterion. Both the Extent of Occurrence (EOO) and Area of Occupancy (AOO) are measured. A very small range size makes a species more vulnerable. This is correct.
(C) Economic value: This is not a direct criterion for assessing biological extinction risk. While high economic value can lead to threats (like overharvesting), the value itself is not part of the IUCN's biological assessment framework. This is incorrect.
(D) Change in population size over time: This is a key criterion. A rapid rate of population decline is a primary indicator of threat. For example, a population reduction of \(\ge\) 80% over 10 years or 3 generations can qualify a species as Critically Endangered. This is correct.
Since options (A), (B), and (D) are all valid IUCN criteria, and the question allows for "one or more" correct answers, all three are part of the assessment process.
Quick Tip: The IUCN Red List criteria are based on five main quantitative measures: (A) Population size reduction, (B) Restricted geographic range, (C) Small population size and decline, (D) Very small or restricted population, and (E) Quantitative analysis showing a high probability of extinction in the wild.
Which one or more of the following processes contribute(s) substantially to increased mean global temperatures?
View Solution
Increased mean global temperatures (global warming) are primarily caused by the enhanced greenhouse effect, resulting from an increase in greenhouse gas concentrations in the atmosphere.
(A) Decreased greenhouse gases in the atmosphere would lead to a weaker greenhouse effect and global cooling, not warming. This is incorrect.
(B) Increased tropical deforestation contributes to warming in two main ways. Firstly, it removes forests that act as carbon sinks (absorbing CO\(_2\)). Secondly, the burning of forests releases large amounts of stored carbon into the atmosphere as CO\(_2\). This is a correct contributor.
(C) Decreased methane emissions would reduce the concentration of a potent greenhouse gas, leading to a reduction in warming. This is incorrect.
(D) Increased fossil fuel use (burning coal, oil, and natural gas) is the single largest human activity contributing to global warming. It releases enormous quantities of carbon dioxide (CO\(_2\)), the primary greenhouse gas, into the atmosphere. This is a correct contributor.
Both (B) and (D) are major contributors to increased global temperatures.
Quick Tip: Remember the main drivers of climate change: the burning of fossil fuels is the number one source of greenhouse gas emissions, followed by land-use changes like deforestation, and certain agricultural practices that release methane and nitrous oxide.
Depending on soil nutrient availability, which one or more of the following interaction(s) can occur between soil mycorrhizal fungi and plants?
View Solution
The interaction between mycorrhizal fungi and plants is a classic example of a context-dependent symbiosis, meaning the nature of the interaction can change based on environmental conditions, such as soil nutrient availability.
(C) Mutualism: This is the most common and well-known interaction. In nutrient-poor soils, the fungus is highly efficient at acquiring nutrients (like phosphorus) and water for the plant, in exchange for carbohydrates (sugars) that the plant produces through photosynthesis. Both partners benefit (+/+).
(A) Parasitism: In nutrient-rich soils, the plant can easily acquire nutrients on its own and may not "need" the fungus. However, the fungus may continue to draw carbohydrates from the plant without providing a significant benefit in return. In this case, the interaction shifts towards parasitism, where the fungus benefits and the plant is harmed (+/-).
(D) Commensalism: It is conceivable that under certain conditions, one partner benefits while the other experiences no net effect (+/0). For example, the fungus might receive some carbon without significantly harming the plant or providing any benefit.
(B) Predation: This involves one organism hunting and killing another for food. It does not describe the symbiotic relationship between a fungus and a plant root.
Therefore, the interaction can range from mutualism to parasitism depending on the environmental context.
Quick Tip: Many symbiotic relationships are not fixed but exist on a continuum from mutualism to parasitism. The outcome of the interaction often depends on the environmental context and the relative costs and benefits for each partner. This is known as the mutualism-parasitism continuum.
Which one or more of the following is/are characteristic of r-selected animals?
View Solution
The concept of r/K selection theory relates to the life history strategies of organisms. r-selection favors traits that maximize the intrinsic rate of population increase (r). This strategy is advantageous in unstable or unpredictable environments.
Let's evaluate the options based on the characteristics of r-selection:
(A) They have a long lifespan. This is incorrect. A long lifespan is a characteristic of K-selected species, which live in stable environments near carrying capacity (K). r-selected species typically have short lifespans.
(B) They produce a large number of offspring in each reproductive event. This is correct. High fecundity (producing many offspring) is a hallmark of r-selection, as it maximizes the potential for rapid population growth.
(C) They produce a few large bodied offspring in each reproductive event. This is incorrect. This describes high parental investment per offspring, which is a K-selected trait. r-selected species produce many small offspring with little to no parental care.
(D) They reproduce at a young age. This is correct. Early age at first reproduction (early maturity) shortens the generation time and is a key trait that contributes to a high population growth rate (r).
Therefore, both producing a large number of offspring and reproducing at a young age are characteristic of r-selected animals.
Quick Tip: Remember 'r' for 'rate' or 'reproduction'. r-selected species are all about rapid reproduction: mature early, have many offspring, short lifespan. In contrast, 'K' is for 'carrying capacity'. K-selected species are adapted to stable environments: mature late, have few offspring, provide parental care, long lifespan.
Which one or more of the following represent(s) benefits of Batesian mimicry to the mimic?
View Solution
Batesian mimicry is a form of mimicry where a harmless species (the mimic) evolves to imitate the warning signals of a harmful species (the model).
The benefit to the mimic comes from predators that have learned to avoid the harmful model.
These predators will also avoid the mimic due to its similar appearance, thus granting the mimic protection.
Let's evaluate the options:
(A) Increased toxicity against potential predators: This is incorrect. The mimic is, by definition in Batesian mimicry, harmless or palatable and does not have the toxicity of the model.
(B) Reduced cooperation: This is unrelated to the concept of Batesian mimicry, which is about predator-prey interactions.
(C) Increased protection from predators without investment in toxicity: This is the core benefit. The mimic gains protection by deception, avoiding the significant metabolic cost of producing toxins or other defenses.
(D) Reduced competition: Mimicry does not directly relate to competition for resources; it is an anti-predator adaptation.
Quick Tip: Remember the key players in Batesian mimicry: a harmful Model, a harmless Mimic, and a duped Predator. The mimic gains protection by "cheating" the system, benefiting from the model's defense without paying the cost.
Which one or more of the following is/are developmental feature(s) of hatchlings of an altricial bird species?
View Solution
Altricial young are those that are born or hatched in a helpless condition, requiring significant parental care. This is in contrast to precocial young, which are relatively mature and mobile from the moment of birth or hatching.
Let's evaluate the features of an altricial bird hatchling:
(A) Eyes open: This is a characteristic of precocial hatchlings (like ducks or chickens) that are alert and mobile soon after hatching. This is incorrect.
(B) Eyes closed: Altricial hatchlings (like robins or pigeons) are born with their eyes closed, as part of their undeveloped state. This is correct.
(C) Down feathers present: A dense coat of down feathers for insulation is characteristic of precocial hatchlings. This is incorrect.
(D) Down feathers absent: Altricial hatchlings are often born naked or with only very sparse, wispy down. The lack of insulating feathers is a key feature of their helplessness. This is correct.
Therefore, both "Eyes closed" and "Down feathers absent" are features of altricial hatchlings.
Quick Tip: Think of the difference between a baby robin (altricial) and a baby duckling (precocial). The robin is naked, blind, and helpless in the nest. The duckling is covered in down, can see, walk, and feed itself almost immediately.
You have a biased coin with the probability of getting a head being 0.6. The probability of getting at least 1 head in 3 tosses is __________.
(Rounded off to three decimal places)
View Solution
The problem asks for the probability of getting "at least 1 head" in 3 tosses.
It is easier to calculate the probability of the complementary event, which is getting "no heads" (i.e., all tails), and subtract this from 1.
P(at least 1 head) = 1 - P(no heads).
First, find the probability of getting a tail (T) in a single toss.
P(T) = 1 - P(Head) = 1 - 0.6 = 0.4.
Next, calculate the probability of getting tails in all three independent tosses.
P(no heads) = P(T and T and T) = P(T) \(\times\) P(T) \(\times\) P(T) = (0.4)\(^3\).
(0.4)\(^3\) = 0.4 \(\times\) 0.4 \(\times\) 0.4 = 0.064.
Finally, substitute this back into the complement formula.
P(at least 1 head) = 1 - 0.064 = 0.936.
The probability rounded to three decimal places is 0.936.
Quick Tip: For probability questions involving "at least one" event, it's almost always simpler to use the complement rule: P(At least one) = 1 - P(None).
A lake has 20 blue male, 30 red male, 60 blue female and 80 red female fish. A researcher catches one individual at random from the lake. If the caught fish is blue, the probability that it is female is __________.
(Rounded off to two decimal places)
View Solution
This is a conditional probability problem. We are given the condition that the caught fish is blue. This means our sample space is reduced from all fish in the lake to only the blue fish.
First, let's find the total number of blue fish in the lake.
Total blue fish = (Number of blue males) + (Number of blue females) = 20 + 60 = 80.
Now, within this group of 80 blue fish, we need to find the number that are female.
Number of blue females = 60.
The probability that a randomly selected fish is female, given that it is blue, is the ratio of the number of blue females to the total number of blue fish.
P(Female | Blue) = \(\frac{Number of blue females}{Total number of blue fish}\)
P(Female | Blue) = \(\frac{60}{80}\) = \(\frac{6}{8}\) = \(\frac{3}{4}\).
As a decimal, \(\frac{3}{4}\) = 0.75.
Rounded to two decimal places, the answer is 0.75.
Quick Tip: In conditional probability problems with counts, you can often avoid the formal formula P(A|B) = P(A and B)/P(B) by simply restricting the sample space. The given condition ("the fish is blue") becomes your new denominator.
A researcher fitted a function to data on how foraging rate (F, number of items consumed per 10 minutes) of a shorebird varied with its group size (G, number of individuals) and obtained the following equation:
logeF = 3 - 0.2 \(\times\) logeG
According to this equation, the foraging rate (F) of a solitary forager is __________ items per 10 minutes.
(Rounded off to the nearest integer)
View Solution
The question asks for the foraging rate (F) of a "solitary forager".
A solitary forager means the group size (G) is 1.
We need to substitute G = 1 into the given equation:
logeF = 3 - 0.2 \(\times\) logeG
logeF = 3 - 0.2 \(\times\) loge(1)
The natural logarithm of 1, loge(1), is equal to 0.
logeF = 3 - 0.2 \(\times\) (0)
logeF = 3 - 0
logeF = 3
To find F, we need to take the exponent of both sides with base e (since loge is the natural logarithm).
F = e\(^3\).
Using the approximate value of e \(\approx\) 2.718:
F \(\approx\) (2.718)\(^3\) \(\approx\) 20.0855.
The question asks to round the result to the nearest integer.
Rounding 20.0855 to the nearest integer gives 20.
Quick Tip: Remember the fundamental properties of logarithms, especially that log\(_b\)(1) = 0 for any base b. This frequently simplifies equations in scientific models. Also, remember that log\(_e\)(x) is the inverse of e\(^x\).
Two species of birds, A and B, are found together in region X. Only species A is present in region Y. Both species produce species-specific alarm calls in response to a predator P. A researcher conducts experiments where she plays recorded calls of both species to species A in regions X and Y. The response of species A to the recorded calls are summarized in the table below.
Based on the results, the most appropriate inference is that

View Solution
Let's analyze the experimental results from the table.
In region X, where species A and B coexist, species A responds to the alarm calls of both species A and species B.
In region Y, where species A lives without species B, species A responds to its own alarm call but does not respond to the alarm call of species B.
An innate behavior is genetically determined and does not require prior experience. If the response to B's call were innate, species A from region Y should have shown the response even without ever encountering species B.
Since the response to B's call is only present in the population of A that coexists with B (region X), it implies that the response is acquired through experience or association (i.e., learning that B's call signals danger).
Therefore, the response to species B's alarm call is a learned behavior.
Quick Tip: To distinguish between learned and innate behaviors in experiments, look for differences between individuals with and without relevant experience. If a behavior is present only in experienced individuals, it is likely learned. If it is present in naive individuals, it is innate.
The table below lists different insects and taxonomic orders. Choose the option that matches the animal to its correct taxonomic order.

View Solution
Let's match each insect group to its correct taxonomic order.
P) Moths: Moths, along with butterflies, belong to the order Lepidoptera (iv). The name means "scale wings".
Q) True bugs: This is the common name for the order Hemiptera (i). They are characterized by piercing-sucking mouthparts.
R) Crickets: Crickets, along with grasshoppers and katydids, belong to the order Orthoptera (ii). The name means "straight wings".
S) Beetles: Beetles are the largest order of insects, Coleoptera (iii). They are characterized by hardened forewings called elytra.
Now we can assemble the correct set of matches:
P -> iv
Q -> i
R -> ii
S -> iii
This corresponds to the combination P-iv; Q-i; R-ii; S-iii, which is option (C).
Quick Tip: Knowing the major insect orders is fundamental in biology. Associate the common names with their scientific order names and a key characteristic: Lepidoptera (butterflies/moths - scaly wings), Coleoptera (beetles - hard elytra), Hemiptera (true bugs - piercing mouthparts), Orthoptera (crickets/grasshoppers - straight wings).
Islands I, II, and III lie off a mainland coast. Which one of the following statements about species richness is consistent with the theory of island biogeography?

View Solution
The MacArthur-Wilson theory of island biogeography predicts species richness based on two factors: island size and distance from the mainland.
1. Distance Effect: Islands closer to the mainland have higher rates of immigration of new species.
2. Area Effect: Larger islands can support larger populations, leading to lower rates of extinction.
To maximize species richness, an island should have the highest possible immigration rate and the lowest possible extinction rate.
This occurs on islands that are large (low extinction) and close to the mainland (high immigration).
Let's analyze the given islands from the figure:
- Island I is large and close.
- Island II is small.
- Island III is large but far.
Based on the theory, Island I will have the highest species richness.
Option (C) correctly states this: "Island I has the highest species richness because it is large and closest to the mainland."
Quick Tip: For island biogeography, remember this simple rule: species richness is maximized on islands that are LARGE and NEAR, and minimized on islands that are SMALL and FAR.
In a polygynous hummingbird species, males defend and monopolize nectar-rich plants (resource). Females visit these plants for nectar and the defending male will have access to all visiting females for mating. Under which scenario is polygyny expected to be the highest?
View Solution
This scenario describes resource defense polygyny. The potential for polygyny is highest when males can economically defend resources that attract multiple females.
The key factor influencing this is the spatial distribution of the resource.
If resources are evenly distributed (A, C), it is very difficult for a single male to monopolize a patch that is significantly better than other patches. Females will be spread out, and the potential for polygyny is low.
If resources are clumped or patchy (B), a male can defend a high-quality clump. This creates a large difference in quality between territories, and females will be concentrated at these valuable, defensible clumps. This creates a high potential for polygyny.
Now considering abundance vs. scarcity for clumped resources:
- If clumped resources are very scarce, a single patch might not be able to support many females, limiting the degree of polygyny.
- If clumped resources are abundant (B), a single male can defend a rich clump that can support and attract a large number of females, leading to the highest level of polygyny.
Therefore, the scenario "Resources are abundant and clumped" provides the greatest opportunity for a single male to monopolize resources that attract the largest number of females.
Quick Tip: The potential for polygyny based on resource defense is maximized when resources are clumped (patchy). This makes them economically defensible and concentrates the limiting sex (females) in predictable locations.
A researcher estimates the relationship between reproductive success (N, number of offspring) and horn length (H, in cm) in a wild goat as
N = 40 - 2.2H + 0.04H\(^2\)
Horn length typically varies from 10 cm to 50 cm in this species. Which one of the following graphs correctly represents this relationship?

View Solution
The given equation is N = 0.04H\(^2\) - 2.2H + 40.
This is a quadratic equation of the form y = ax\(^2\) + bx + c, where N is y and H is x.
The coefficient of the H\(^2\) term is a = 0.04. Since this coefficient is positive (a > 0), the graph of the equation is a parabola that opens upwards. This shape is often described as "U-shaped".
Let's examine the graphs provided:
- P and R are straight lines (linear relationships). They are incorrect.
- S is a parabola that opens downwards (an inverted U-shape), which would correspond to a negative coefficient for H\(^2\). It is incorrect.
- Q is a parabola that opens upwards (a U-shape). This matches the form of the equation.
This indicates that there is disruptive selection on horn length, where both small and large horns have higher reproductive success than intermediate-sized horns. Graph Q correctly depicts this U-shaped relationship.
Quick Tip: For a quadratic equation y = ax\(^2\) + bx + c, the sign of the 'a' coefficient determines the shape of the parabola. If a > 0, the parabola opens upwards (U-shape). If a < 0, the parabola opens downwards (inverted U-shape).
Overfishing reduced food availability for sea lions in California, causing a decline in their population size. In 1972, under the US Endangered Species Act, fishing was banned from sea lion foraging areas. Subsequently, the population of sea lions increased in a logistic form as shown in the figure.
The per capita growth rate is highest in the interval __________ and the population growth rate is highest in the interval __________.

View Solution
The graph shows a logistic (S-shaped) population growth curve. We need to distinguish between per capita growth rate and population growth rate.
Per capita growth rate (r): This is the growth rate per individual. In the logistic model, it is highest when the population size (N) is very small and density-dependent factors are weakest. Looking at the graph, the population size is lowest in interval I. Therefore, the per capita growth rate is highest in interval I.
Population growth rate (dN/dt): This is the total number of individuals added to the population per unit time. In the logistic model, the population growth rate is calculated as dN/dt = rN(1 - N/K). This rate is maximal when the population size is half the carrying capacity (N = K/2). The graph shows the steepest slope (fastest increase in abundance) during interval II, which corresponds to the inflection point of the S-curve where N is approximately K/2.
Therefore, the per capita growth rate is highest in interval I, and the population growth rate is highest in interval II.
Quick Tip: In logistic growth, don't confuse per capita growth rate with population growth rate. Per capita rate is highest at the very beginning (N is low). Population rate (total number of new individuals) is highest at the midpoint (N=K/2), which is the steepest part of the S-curve.
A locus at Hardy-Weinberg equilibrium in a diploid organism has n alleles. The maximum heterozygosity (i.e., proportion of heterozygotes) for this locus is
View Solution
Heterozygosity (H) is the proportion of heterozygotes in a population. It is calculated as H = 1 - \(\sum p_i^2\), where \(p_i\) is the frequency of the i-th allele.
To maximize heterozygosity (H), we need to minimize the sum of the squared allele frequencies (\(\sum p_i^2\)).
For a given number of alleles (n), the sum \(\sum p_i^2\) is minimized when all allele frequencies are equal.
If there are n alleles, and their frequencies are equal, then each allele has a frequency of \(p_i = 1/n\).
Now, we can calculate the minimum value of \(\sum p_i^2\):
\(\sum p_i^2\) = \(p_1^2 + p_2^2 + ... + p_n^2\)
= \((1/n)^2 + (1/n)^2 + ... + (1/n)^2\) (n times)
= n \(\times\) \((1/n)^2\) = n / n\(^2\) = 1/n.
Finally, substitute this back into the formula for maximum heterozygosity (H\(_{max}\)).
H\(_{max}\) = 1 - (minimum value of \(\sum p_i^2\))
H\(_{max}\) = 1 - (1/n).
Quick Tip: In population genetics, diversity (like heterozygosity) is maximized when the alleles are as evenly distributed in frequency as possible. For n alleles, this means each has a frequency of 1/n.
Match the diseases to the pathogens that cause them.

View Solution
Let's match each disease to its causative pathogen.
P) Avian malaria: Like human malaria, avian malaria is caused by a protozoan parasite of the genus Plasmodium. A mosquito is the vector that transmits the disease, not the pathogen itself. So, P matches with (ii) Plasmodium.
Q) COVID-19 in humans: COVID-19 is a well-known respiratory disease caused by the SARS-CoV-2 coronavirus. So, Q matches with (i) Virus.
R) Chytrid disease in frogs: This disease, properly called chytridiomycosis, has caused massive declines in amphibian populations worldwide. It is caused by the chytrid fungus Batrachochytrium dendrobatidis. So, R matches with (iv) Fungus.
Assembling the correct pairs: P-ii, Q-i, R-iv. This corresponds to option (C).
Quick Tip: When matching diseases, pathogens, and vectors, be precise. The pathogen is the organism that causes the disease (e.g., Plasmodium). The vector is the organism that transmits the pathogen (e.g., mosquito).
The production of anthocyanin pigments in pea flowers requires the presence of at least one dominant allele in each of two independently assorting genes, C and P. The presence of anthocyanin results in purple flowers, whereas its absence gives white flowers. A cross between two double heterozygous (CcPp) plants is performed. What is the expected ratio of plants with purple flowers to plants with white flowers?
View Solution
This is a dihybrid cross involving complementary gene action, a type of epistasis.
Purple flowers are produced only when the genotype is C_P_. Any other genotype (C_pp, ccP_, or ccpp) results in white flowers because both dominant alleles are required for the pigment pathway to be completed.
Let's perform a standard dihybrid cross between two CcPp individuals. The expected genotypic ratio of the offspring is:
9 C_P_
3 C_pp
3 ccP_
1 ccpp
Now, let's map these genotypes to the phenotypes (flower color).
- Purple flowers: Genotype must be C_P_. The proportion is 9/16.
- White flowers: Genotypes are C_pp, ccP_, and ccpp. The proportion is (3/16) + (3/16) + (1/16) = 7/16.
The expected phenotypic ratio of purple flowers to white flowers is 9:7.
Quick Tip: The 9:7 phenotypic ratio is a classic signature of complementary gene action. It's a modification of the standard 9:3:3:1 ratio, where the last three classes (3+3+1=7) are phenotypically identical.
In the phylogenetic trees shown, the tips represent different species of geckos (labeled A to E) and the areas to which they belong. Which one of these is most consistent with the hypothesis that the geckos colonized the Western Ghats from Northeast India through the Eastern Ghats?

View Solution
The hypothesis states a specific colonization route: Northeast India -> Eastern Ghats -> Western Ghats.
A phylogenetic tree consistent with this hypothesis should show that:
1. The species from Northeast India is the most basal group (diverged earliest).
2. The species from the Eastern Ghats form a clade that is sister to the species from the Western Ghats.
3. The species from the Western Ghats should be the most derived group (diverged most recently).
Let's examine the trees:
- In tree P, a Western Ghats species (C) is sister to a Northeast India species (D), which is inconsistent.
- In tree Q, the Northeast India species (D) is nested within the Eastern Ghats species, which is plausible, but the Western Ghats species (B) is shown as the most basal group, contradicting the hypothesis.
- In tree R, the Northeast India species (D) is the most basal lineage. The next split separates the Eastern Ghats species (A and E) from the Western Ghats species (B and C). This perfectly matches the hypothesized colonization route: an ancestral group from Northeast India gave rise to a group that colonized the Eastern Ghats, and from that group, a lineage colonized the Western Ghats.
- In tree S, the relationship shows Western Ghats (B) sister to a clade of Eastern Ghats and Northeast India, which is inconsistent.
Therefore, tree R is the most consistent with the hypothesis.
Quick Tip: When interpreting phylogenies to test biogeographic hypotheses, map the colonization route onto the branching pattern. The source population should be represented by the earliest diverging (most basal) lineage, and subsequent locations should appear in order as you move towards the tips of the tree.
The phylogenetic tree depicts the relationship between 5 species of snakes (labelled A to E) and provides information about their habitat specialization. Given the principle of parsimony (least number of evolutionary changes required) and that ancestor Y was terrestrial, which one of the options given is correct?
 \
\
View Solution
To apply the principle of parsimony, we choose the ancestral state assignment that requires the \emph{fewest evolutionary changes.
We are given that:
Ancestor \(Y\) is terrestrial.
Species habitats:
A = aquatic,\; B = terrestrial,\; C = aquatic,\; D = aquatic,\; E = terrestrial.
From the tree, \(Y\) splits into species \(E\) and ancestor \(X\).
Ancestor \(X\) further gives rise to species \(A\), \(B\), \(C\), and \(D\) through intermediate internal nodes (not explicitly labelled).
We compare two hypotheses about the habitat of ancestor \(X\).
[4pt]
Scenario 1: Assume \(X\) is terrestrial.
\(Y(T) \rightarrow X(T)\) requires \(0\) changes.
\(X(T) \rightarrow B(T)\) requires \(0\) changes.
The ancestor of A, C, and D must be aquatic (since all three are aquatic).
Thus, \(X(T) \rightarrow Ancestor(A,C,D)(A)\) requires \(1\) change.
Total evolutionary changes in this scenario:
\[ 1 change \]
Scenario 2: Assume \(X\) is aquatic.
\(Y(T) \rightarrow X(A)\) requires \(1\) change.
\(X(A) \rightarrow B(T)\) requires \(1\) change.
\(X(A) \rightarrow Ancestor(A,C,D)(A)\) requires \(0\) changes.
Total evolutionary changes in this scenario:
\[ 2 changes \]
Conclusion:
Since parsimony selects the scenario with the \emph{fewest changes:
\[ \boxed{1 < 2} \]
The more parsimonious scenario is that ancestor X was terrestrial.
Thus, the correct answer is:
\[ \boxed{(B) X was more likely to be terrestrial than aquatic} \] Quick Tip: To apply the principle of parsimony, calculate the total number of evolutionary changes (state transitions) required for each competing hypothesis. The hypothesis that requires the fewest changes is considered the most likely, or most parsimonious.
The mode of speciation in snakes in the Western Ghats is predominantly allopatric. A researcher wants to quantify diversification of snakes in this range. From the options given, choose the most cost and time efficient way to sample snakes.
View Solution
The question states that speciation is predominantly allopatric.
Allopatric speciation occurs when populations of the same species become geographically isolated from one another, preventing or interfering with gene flow.
To study this process of diversification, a researcher should focus on sampling populations on opposite sides of potential geographic barriers.
In the Western Ghats, major rivers and deep valleys act as significant barriers to the movement of many species, including snakes, leading to the isolation of populations.
Let's evaluate the sampling strategies:
(A) Sampling across an elevational gradient is more suited for studying parapatric speciation or local adaptation, not allopatric speciation driven by major barriers.
(B) Sampling across barriers like valleys and rivers directly targets the mechanism of allopatric speciation. By comparing populations on either side, one can look for genetic divergence and potential speciation events. This is the most targeted and efficient approach.
(C) Sampling in one or two random locations would likely miss the key geographic boundaries and fail to capture the diversification process.
(D) Sampling intensively across the entire range is ideal but not cost and time efficient. A targeted approach is better.
Quick Tip: When designing a study, the sampling strategy should be tailored to the specific hypothesis being tested. For allopatric speciation, sampling should be stratified across the geographic barriers thought to be driving the divergence.
All else being equal, which one of the following population sizes (N) and migration rates (m) would result in the most genetic differentiation between populations (F\(_{st}\))?
Note that F\(_{st}\) is computed as
F\(_{st}\) = \(\frac{1}{4Nm + 1}\)
View Solution
The formula for genetic differentiation is given as F\(_{st}\) = \(\frac{1}{4Nm + 1}\).
We want to find the combination of N (population size) and m (migration rate) that results in the most genetic differentiation, which means we want to maximize the value of F\(_{st}\).
To maximize the fraction F\(_{st}\), we need to minimize the denominator (4Nm + 1).
This means we need to find the option with the minimum value for the product Nm.
Let's calculate the value of Nm for each option:
(A) Nm = 500 \(\times\) 1 = 500.
(B) Nm = 200 \(\times\) 200 = 40000.
(C) Nm = 40 \(\times\) 10 = 400.
(D) Nm = 40 \(\times\) 1 = 40.
The minimum value of Nm is 40, which occurs in option (D).
A smaller value of Nm (the effective number of migrants per generation) leads to less gene flow, which in turn allows for greater genetic differentiation (higher F\(_{st}\)) between populations due to genetic drift.
Quick Tip: Genetic differentiation (F\(_{st}\)) is inversely related to gene flow (migration). To maximize differentiation, you need to minimize gene flow. In the given formula, this means minimizing the product Nm.
Which one or more of the following is/are prediction(s) or assumption(s) of the handicap principle for the evolution of sexual signals?
View Solution
The handicap principle, proposed by Amotz Zahavi, is a hypothesis to explain how honest sexual signals evolve.
The core idea is that for a signal to be reliable, it must be costly to produce, and the cost must be differentially higher for lower-quality individuals.
Let's evaluate the options based on this principle:
(A) Females prefer costly signals. This is a prediction. Because the signals are costly and honest, females evolve a preference for them as a way to choose high-quality mates.
(B) Honest signals are costly to produce. This is a fundamental assumption of the principle. The cost is what enforces the honesty of the signal.
(C) Males displaying costly signals are not chosen by females. This is incorrect. The principle predicts the exact opposite: females should choose males with the most extravagant (costly) signals.
(D) Costly signals are reliable indicators of signaller quality. This is the central tenet of the hypothesis. Only high-quality males can "afford" to produce the costly signal, so the signal becomes a reliable (honest) indicator of their underlying genetic quality.
Therefore, (A), (B), and (D) are all key components of the handicap principle.
Quick Tip: The handicap principle can be summarized as: "Cost enforces honesty." A sexually selected trait (like a peacock's tail) is a handicap because it's expensive to produce and maintain. Only the highest quality males can bear this handicap, so the trait becomes an honest signal of quality to females.
A research team assesses the impact of the invasive species Lantana camara on the seed set of a native flowering plant S. The plant S usually grows in clumps with other individuals of the same or different flowering species. They measure the seed set of flowering individuals of S grown (i) alone; (ii) with a conspecific (same species); (iii) with a native species Q; (iv) with a native species R; (v) with Lantana camara. The figure below shows the mean seed set with 95% confidence intervals for the different treatments.
Based on the figure provided, which one or more of the options given is/are correct?

View Solution
We need to compare the mean seed set values for different treatments based on the bar chart, paying attention to the confidence intervals for statistical significance.
Let's estimate the mean values from the chart:
- Alone: ~200
- Conspecific: ~210
- Native Q: ~125
- Native R: ~250
- Lantana: ~50
Now evaluate the options:
(A) Seed set is higher in the presence of both the native species than in the presence of a conspecific. This is false. The seed set with native Q (~125) is lower than with a conspecific (~210).
(B) Seed set is lower in the presence of Lantana camara than in the presence of both the native species. The seed set with Lantana is ~50. The seed set with native Q is ~125 and with native R is ~250. 50 is clearly lower than both 125 and 250, and the confidence intervals do not overlap. This statement is correct.
(C) Seed set is lower in the presence of Lantana camara than in the presence of a conspecific. The seed set with Lantana is ~50, while with a conspecific it is ~210. 50 is clearly lower than 210, and their confidence intervals do not overlap. This statement is correct.
(D) Seed set is always higher in the presence of other plants than when grown alone. This is false. The seed set with native Q (~125) and with Lantana (~50) are both lower than the seed set when grown alone (~200).
Therefore, both statements (B) and (C) are correct inferences from the figure.
Quick Tip: When interpreting bar charts with confidence intervals (or error bars), a common rule of thumb is that if the intervals for two means do not overlap, the difference between the means is statistically significant.
There are two palatable prey species, Q and R, for an insectivorous bird species in a forest. However, the bird searches for and consumes only species Q. According to optimal foraging theory, which one or more of the following conditions can explain the bird choosing to forage only for Q?
View Solution
This question relates to the diet choice model within optimal foraging theory. The model predicts that a forager should specialize on the most profitable prey (prey Q in this case) if the rate of encounter with that prey is high enough.
Profitability is defined as Energy content / Handling time (E/h). Let's assume Q is the more profitable prey, which is why it is preferred.
The decision to ignore a less profitable prey (R) depends on the abundance of the more profitable prey (Q).
The model states: A forager should specialize on prey 1 (Q) and ignore prey 2 (R) if the energy gain from searching for and eating only prey 1 is greater than the energy gain from eating both prey as they are encountered.
This condition simplifies to: \(E_1/h_1 > E_2/(S_2 + h_2)\). However, the key insight is that the decision to exclude a less profitable prey depends only on the abundance of the more profitable prey.
If the abundance of the profitable prey Q is very high, the search time for Q is very low. This makes it optimal for the bird to ignore the less profitable prey R, even if R is also abundant. The bird doesn't 'waste' time handling R when another Q is just around the corner.
Therefore, a high relative abundance of the preferred prey (Q) is the condition that promotes specialization on Q.
(A) and (B) relate to handling time, which determines profitability, but not the decision to specialize once profitability is established. Assuming Q is the preferred prey, it must be more profitable, which usually implies a shorter handling time (B) or higher energy, or both. But the abundance of Q is what drives the specialization.
(C) High relative abundance of Q reduces search time and makes specializing on Q the optimal strategy. This is correct.
(D) If Q were rare, the bird would have to be a generalist and eat R as well. This is incorrect.
Quick Tip: The diet choice model in optimal foraging theory has a key, non-intuitive prediction: whether to eat a less profitable prey item depends on the abundance of the more profitable prey, not the abundance of the less profitable prey itself. High abundance of good food promotes specialization.
Conservation biologists have debated whether protected areas should be designed as a single large patch or as several small patches. Assuming that the total area is the same for the two designs, which one or more of the options describe(s) the conservation benefit(s) of several small patches?
View Solution
This question is about the "Single Large Or Several Small" (SLOSS) debate in conservation biology. We are asked for the benefits of the "Several Small" (SS) design.
(A) Lower rates of local extinction: This is incorrect. Small patches support smaller population sizes, which are more vulnerable to local extinction due to stochastic events. This is a primary argument against several small patches.
(B) Lower rates of diversification: This is generally considered a negative outcome, not a benefit. Also, isolation between small patches might promote diversification over long timescales, but that's not typically framed as a short-term conservation benefit.
(C) Lower spread of disease across the populations: This is a key benefit. If a catastrophic event like a fire, storm, or disease outbreak strikes one patch, the isolated populations in the other patches are buffered and may survive. The fragmentation acts as a firebreak against the spread of disaster. This is correct.
(D) Lower population sizes: This is a major disadvantage of small patches, not a benefit. Small populations suffer from inbreeding and are more prone to extinction.
Quick Tip: The SLOSS debate highlights trade-offs in reserve design. Single Large (SL) is better for species with large area requirements and minimizes edge effects. Several Small (SS) can cover more habitat types and provides a buffer against localized catastrophes ("don't put all your eggs in one basket").
Which one or more options is/are example(s) of niche partitioning between species?
View Solution
Niche partitioning (or resource partitioning) is the process by which competing species use the environment differently in a way that helps them to coexist. It is a mechanism to reduce interspecific competition. The "niche" can be partitioned along several axes or dimensions.
(A) Temporal separation of activity: This is a form of niche partitioning. For example, one predator species hunts at night (nocturnal) while a competing species hunts during the day (diurnal), thus reducing competition for the same prey.
(B) Diet specialization: This is a classic example. Competing species may evolve to specialize on different food sources. For example, different finch species eating seeds of different sizes.
(C) Hybridization: This is the interbreeding of two different species. It is a breakdown of reproductive isolation, not a mechanism for niche partitioning. It often leads to reduced fitness and is generally not a stable coexistence mechanism.
(D) Vertical stratification of foraging heights: This is a form of spatial niche partitioning. For example, different species of warblers may forage for insects at different heights within the same tree, thereby reducing competition.
Therefore, (A), (B), and (D) are all valid examples of niche partitioning.
Quick Tip: Niche partitioning can be remembered by thinking about the different ways species can avoid conflict: they can use resources at different times (temporal), in different places (spatial, like foraging heights), or eat different things (dietary).
In an assemblage of coexisting wild cat species, the size of canine teeth was found to be strikingly different between these species. Which one or more of the following statements explain(s) this observation?
View Solution
The observation is that coexisting cat species have different canine tooth sizes. This pattern is a classic example of character displacement.
(A) Differences in the size of canine teeth were driven by the size of prey captured by the different species. This is the ecological mechanism. Canine size is directly related to the size and type of prey a cat can efficiently kill. Different canine sizes allow for niche partitioning, where each cat species specializes on different prey, reducing competition. This is a very strong explanation.
(B) Differences in the size of canine teeth are an example of divergent evolution. This is correct from a phylogenetic perspective. Closely related species have diverged in this trait, likely due to selective pressures from competition.
(C) Differences in the size of canine teeth are an example of convergent evolution. This is incorrect. Convergent evolution is when unrelated species evolve similar traits. Here we are talking about related species becoming more different.
(D) Differences in the size of canine teeth were driven by past competition. This is the evolutionary driver. The phenomenon of character displacement, where coexisting species are more different from each other than they are from allopatric populations, is thought to be driven by natural selection to reduce competition (the "ghost of competition past"). This is also a strong explanation.
Statements (A), (B) and (D) all provide valid, interconnected explanations for the observed pattern.
Quick Tip: Character displacement is a key concept where differences among similar species are accentuated where they co-occur. It is thought to be caused by interspecific competition in the past, leading to niche partitioning (like specializing on different prey sizes) and divergent evolution of the relevant traits (like canine size).
The Biological Species Concept (BSC) states that 'species are groups of interbreeding natural populations that are reproductively isolated from other such groups'. Which one or more of the options could pose challenges for defining species using the BSC?
View Solution
The Biological Species Concept (BSC) defines species based on reproductive isolation. We are looking for situations where this criterion is difficult or impossible to apply.
(A) Fertile interspecies hybrids: If individuals from two different groups can interbreed and produce fertile offspring (hybrids), then they are not reproductively isolated. This directly challenges the BSC's definition. Many plant and some animal species are known to hybridize, making species boundaries fuzzy under the BSC. This is a challenge.
(B) Extinct fossil species: The BSC relies on observing interbreeding. It is impossible to determine the breeding capabilities of extinct organisms known only from fossils. Therefore, the BSC cannot be applied to the fossil record. This is a challenge.
(C) Barriers to gene flow: Barriers to gene flow are actually the mechanism that leads to reproductive isolation and speciation under the BSC. The existence of these barriers supports the BSC, it does not challenge it. This is incorrect.
(D) Inbreeding depression: This is a phenomenon that occurs within a species or population due to mating between close relatives. It is not related to the definition of species boundaries between different groups. This is incorrect.
Quick Tip: The Biological Species Concept has major limitations. Remember the three 'A's: it cannot be applied to Asexual organisms, Allopatric populations (where it's unclear if they would interbreed), or Ancient (fossil) species. It is also challenged by hybridization.
The barnacle species, Chthamalus stellatus (CS), is found only in the high intertidal zone whereas Balanus glandula (BG) is found only in the low intertidal zone. A researcher transplanted CS from the high to low (T-CS), and BG from the low to high (T-BG) intertidal zones. Additionally, they allowed the species to grow alone or in competition with each other, and quantified survival.
Which one or more of the following inferences is/are consistent with the experimental results shown below?

View Solution
This is a classic experiment on species distribution, fundamental niche, and realized niche.
Let's analyze the fate of each species:
Balanus (BG):
- Look at the survival of transplanted BG (T-BG) in the high intertidal zone.
- When grown ALONE, survival is low (~40%). This indicates that abiotic conditions (like desiccation) in the high zone are stressful for BG.
- When grown TOGETHER with CS, survival is still low (~30%), and not significantly different from when grown alone (confidence intervals likely overlap).
- This suggests that competition from CS is not the main reason for BG's low survival in the high zone; the abiotic stress is the primary factor. So, statement (A) is correct and (C) is incorrect.
Chthamalus (CS):
- Look at the survival of transplanted CS (T-CS) in the low intertidal zone.
- When grown ALONE, survival is very high (~90%). This shows that CS can tolerate the abiotic conditions of the low zone perfectly well. So, statement (B) is incorrect. Its fundamental niche includes the low zone.
- When grown TOGETHER with BG, the survival of CS drops dramatically to near zero (~10%).
- Since CS can survive well alone in the low zone but dies in the presence of BG, this indicates that strong interspecific competition from BG is causing the high mortality of CS in the low zone. So, statement (D) is correct.
Conclusion: The upper limit of Balanus (BG) is set by abiotic factors, while the lower limit of Chthamalus (CS) is set by biotic factors (competition). The correct inferences are (A) and (D).
Quick Tip: This experiment is a famous example demonstrating the difference between a species' fundamental niche (where it can live, determined by abiotic factors) and its realized niche (where it does live, restricted by biotic interactions like competition).
In the figure below, ellipse X represents the combinations of salt concentrations and temperatures that a marine invertebrate species can tolerate. Ellipse Y represents the combinations of salt concentrations and temperatures that this species is actually found in.
Which one or more of the following statements about X and Y is/are correct?

View Solution
This question defines the concepts of fundamental and realized niche using a diagram.
- Ellipse X shows all environmental conditions (temperature and salt) where the species can survive and reproduce, based on its physiological tolerance. This is the definition of the fundamental niche.
- Ellipse Y shows the environmental conditions where the species is actually found. This is the definition of the realized niche.
(A) X is the fundamental niche of the species, whereas Y is the realized niche. This statement is correct by definition.
The realized niche (Y) is a subset of the fundamental niche (X). The question is, what causes this restriction?
(B) The difference between X and Y can result from biotic interactions. This is a primary reason. Negative interactions like competition, predation, or parasitism can prevent a species from occupying parts of its fundamental niche. For example, a superior competitor might exclude the species from the lower-temperature parts of its fundamental niche. This is correct.
(C) The difference between X and Y can result from dispersal limitation. A species may not be found in a suitable habitat patch (which is part of its fundamental niche) simply because it has not been able to disperse there. This is also a correct explanation for why the realized niche is smaller than the fundamental niche.
(D) The difference between X and Y results from the species' tolerance to salt concentrations. This is incorrect. The tolerance to salt concentrations (and temperature) defines the boundary of the fundamental niche (X), it does not explain why the realized niche (Y) is smaller than X.
Quick Tip: Remember the relationship: Realized Niche \(\subseteq\) Fundamental Niche. The factors that shrink the fundamental niche down to the realized niche are primarily biotic interactions (competition, predation) and dispersal limitations. The fundamental niche itself is defined by abiotic tolerances.
A butterfly species inhabits four types of patchy landscapes (P, Q, R, S). Grey shapes represent occupied habitat and white shapes are unoccupied. Arrows represent the occurrence and directions of possible dispersal.
Which one or more of the options is/are likely to be correct?

View Solution
Let's analyze each landscape based on metapopulation theory.
(A) In landscape Q, patch w is a source population. A source population is one that has a net emigration rate (more individuals leave than arrive). In diagram Q, patch w has arrows pointing to it, but none pointing away. This suggests it is a sink population, receiving immigrants but not producing any dispersers. Thus, this statement is likely incorrect.
(B) Landscape R represents a metapopulation. A metapopulation is a "population of populations," a set of spatially separated populations of the same species which interact via dispersal. Landscape R shows several occupied patches (grey) with dispersal (arrows) occurring between them, and unoccupied patches (white) available for colonization. This fits the definition of a metapopulation. This statement is correct.
(C) Landscape P has the highest extinction rate. Landscape P shows a single, small, isolated occupied patch with no other patches nearby for rescue effect (recolonization by immigrants). Small, isolated populations have the highest probability of extinction due to stochastic events. This statement is likely correct.
(D) Landscape S has the highest level of inbreeding. Inbreeding is highest in small, isolated populations. Landscape S shows a large number of interconnected populations with frequent dispersal among them. This high connectivity would lead to high gene flow, which reduces inbreeding. Landscape P would have the highest level of inbreeding. Thus, this statement is incorrect.
Quick Tip: Key metapopulation concepts: a metapopulation is a network of connected populations. Extinction risk is highest in small, isolated patches. Source populations are net exporters of individuals, while sink populations are net importers. Connectivity (gene flow via dispersal) reduces inbreeding and facilitates the "rescue effect".
A new food requesting behaviour has been observed in bonnet macaques in Bandipur National Park. The macaques extend their hand and make a cooing sound only towards humans, which effectively results in food given to them. If this behaviour is to increase in frequency in the population over time by the process of natural selection, which one or more of the options below is/are necessary condition(s)?
View Solution
Natural selection requires three necessary and sufficient conditions for a trait to evolve:
1. Variation: Individuals in a population must vary in the trait. (This is implied by "a new ... behaviour has been observed").
2. Heritability: The variation in the trait must be heritable, meaning it can be passed from one generation to the next (either genetically or through cultural transmission).
3. Differential Fitness: The variation in the trait must be associated with differences in survival and/or reproduction (fitness).
Let's evaluate the options based on these conditions:
(A) Food requesting behaviour must be transmitted from one generation to the next. This is the condition of heritability. It is absolutely necessary for the trait to be passed on for its frequency to change across generations. This is correct.
(B) All bonnet macaques in the area must show this behaviour. This is incorrect. Natural selection requires variation. If all individuals were the same, there would be no selection.
(C) Macaques who receive food using this behaviour are able to have more offspring. This is the condition of differential fitness. The behavior must lead to increased reproductive success for it to be selected for. Access to more food could lead to better health and more offspring. This is correct.
(D) Food requesting behaviour must only be taught by parents to offspring. This describes a specific mode of transmission (vertical cultural transmission). While the behavior must be heritable (A), it doesn't have to be transmitted only by parents. It could be learned from other individuals as well (horizontal or oblique transmission). This is too restrictive and not a necessary condition.
Quick Tip: Remember the three pillars of natural selection: Variation, Heritability, and Differential Fitness (or Selection). For any trait to evolve by natural selection, it must vary among individuals, be passed on to the next generation, and affect how many offspring an individual produces.
Two co-occurring plant species, A and B, flower at the same time. They are visited by the same pollinator species. If these plants are pollinator-limited, then which one or more of the following statements is/are correct with regard to the figure shown below?

View Solution
Assumptions and interpretation of the plot:
Let the \emph{x-axis be the density (or abundance) of species B and the \emph{y-axis be the pollination (or pollinator visitation rate / reproductive success) of species A. The system is \emph{pollinator-limited, so changes in B that affect pollinator behaviour will influence A.
\medskip
Biological meaning of possible slopes:
Positive slope: As B density increases, pollination of A increases. This means B helps attract more pollinators (or keeps pollinators longer), so A benefits — \emph{facilitation (a positive interaction).
Zero (horizontal) slope: A's pollination is unaffected by B density — \emph{neutral interaction (no effect).
Negative slope: As B density increases, pollination of A decreases. This indicates B and A compete for the limited pollinator visits — \emph{competition (a negative interaction).
\medskip
Apply to the three lines in the figure (standard labeling):
Line 1: has a \emph{positive slope \(\Rightarrow\) \emph{facilitation (B increases pollinator visits that also benefit A).
Line 2: is \emph{horizontal \(\Rightarrow\) \emph{neutral (no effect).
Line 3: has a \emph{negative slope \(\Rightarrow\) \emph{competition (B reduces pollinator service to A).
\medskip
Evaluation of the options:
(A) ``Line 1 represents competition.'' \quad \(\times\) \; Incorrect under the standard reading (Line 1 is positively sloped \(\Rightarrow\) facilitation).
(B) ``Line 2 represents mutualism.'' \quad \(\times\) \; Incorrect — Line 2 is neutral, not mutualistic.
(C) ``Line 3 represents parasitism.'' \quad \(\times\) \; Incorrect (terminology) — Line 3 indicates competition for pollinators (a negative interaction); this is best described as \emph{competition, not parasitism (parasitism implies an exploitative consumer–resource relationship, which is not the usual description for shared-pollinator effects).
(D) ``Line 1 represents facilitation.'' \quad \(\checkmark\) \; Correct under the standard interpretation (positive slope).
\medskip
Final statement: Based on the figure and the pollinator-limited context, the correct interpretation is that Line 1 = facilitation, Line 2 = neutral, Line 3 = competition. Therefore option (D) is correct.
Quick Tip: When analyzing graphs of species interactions, determine the effect of one species (x-axis) on the other (y-axis). A positive slope indicates a positive effect (+), a negative slope indicates a negative effect (-), and a flat line indicates no effect (0). These define interactions like competition (-/-), facilitation (+/0 or +/+), and neutralism (0/0).
Scorpions on the sand dunes in Syria in September 2022 have the age distribution as shown in Figure P. Scorpions can live to a maximum of 90 days. In all the figure panels, the x-axis represents age class and the y-axis represents number of individuals.
Assuming no immigration or emigration, which one or more of the age distribution panels Q, R, S, T is/are possible 30 days later?


View Solution
What happens after 30 days (deterministic constraints):
Every individual ages by 30 days. Thus individuals initially in class \(1\!-\!30\) move into class \(31\!-\!60\), those in \(31\!-\!60\) move into \(61\!-\!90\), and those in \(61\!-\!90\) would exceed 90 days and die (\( \Rightarrow \) they do not contribute to the future classes).
Mortality can reduce the numbers during the 30 days, so the numbers that actually arrive in the next classes are \emph{at most the numbers listed above.
New recruits (newborns) populate the new \(1\!-\!30\) class. The number of recruits \(b\) is unknown but must satisfy \(b\ge 0\).
Therefore the \emph{necessary inequalities for the counts 30 days later are: \[ \begin{aligned} new n_1 &= b \ge 0,
new n_2 &\le n_1 \quad(cannot exceed the previous 1\!-\!30 class) \Rightarrow new n_2 \le 50,
new n_3 &\le n_2 \quad(cannot exceed the previous 31\!-\!60 class) \Rightarrow new n_3 \le 20. \end{aligned} \]
Check each candidate panel (feasibility vs.\ the inequalities):
\(Q:\) (panel \(Q\) shows values that violate at least one of the above bounds)
\quad If \(Q\) displays \(new n_3>20\) (i.e. more individuals in 61--90 than the previous 31--60 had), this is impossible, because only those who were in 31--60 can become 61--90. Hence \(Q\) is not feasible.
\(R:\) (panel \(R\) shows an increase of the oldest class substantially above the previous middle class)
\quad \(R\) requires \(new n_3 > 20\) (or otherwise violates the bounds) — \(\Rightarrow\) impossible.
\(S:\) (panel \(S\) displays new \(n_2\le 50\) and new \(n_3\le 20\), with some modest recruitment \(b\ge0\))
\quad All bounds can be satisfied by letting some mortality occur in the cohorts and choosing an appropriate \(b\). Thus \(S\) is possible.
\(T:\) (panel \(T\) displays new \(n_2\le 50\) and new \(n_3\le 20\), but with larger recruitment \(b\))
\quad Since births can be large (no upper limit given) and the aging constraints are satisfied, \(T\) is also possible.
Conclusion: Panels \(S\) and \(T\) satisfy the necessary aging/mortality constraints and therefore \(\boxed{S and T are possible}\). Panels \(Q\) and \(R\) require more old individuals than there were middle-aged individuals 30 days earlier and hence are impossible under the no-immigration, no-emigration assumption. Quick Tip: When projecting age structures forward in time, first "age" each cohort into the next class. Then, account for mortality, meaning the number in the new, older class must be less than or equal to the number in the original, younger class. Finally, add the new recruits (births) to the youngest age class.
The Shannon-Weaver index H is a measure of diversity and is calculated as
H = - \(\sum_{i=1}^{S} p_i \ln(p_i)\)
where S is the total number of species and \(p_i\) is the proportional abundance of a species i.
The table below gives the abundance of different species in a community. The Shannon-Weaver index of reptile diversity in this community is __________.
(Rounded off to two decimal places)

View Solution
The Shannon--Weaver index is \[ H \;=\; -\sum_{i=1}^{S} p_i\ln(p_i), \]
where \(p_i\) is the proportional abundance of species \(i\).
Step 1: Identify reptile species and their abundances
From the table the reptile species and abundances are: \[ \begin{array}{ll} Indian gliding lizard & 270
[2pt] Travancore tortoise & 180
[2pt] Forest cane turtle & 120
[2pt] Malabar pit viper & 30 \end{array} \]
Total reptile individuals: \(N_{reptiles} = 270+180+120+30 = 600\).
Step 2: Proportions \[ \begin{aligned} p_1 &= \tfrac{270}{600}=0.45,
p_2 &= \tfrac{180}{600}=0.30,
p_3 &= \tfrac{120}{600}=0.20,
p_4 &= \tfrac{30}{600}=0.05. \end{aligned} \]
Step 3: Compute each term \(p_i\ln p_i\) \[ \begin{aligned} p_1\ln p_1 &= 0.45\ln(0.45) \approx -0.359325,
p_2\ln p_2 &= 0.30\ln(0.30) \approx -0.361191,
p_3\ln p_3 &= 0.20\ln(0.20) \approx -0.321887,
p_4\ln p_4 &= 0.05\ln(0.05) \approx -0.149786. \end{aligned} \]
Step 4: Sum and take negative \[ \sum_{i=1}^4 p_i\ln p_i \approx -1.192189 \quad\Longrightarrow\quad H = -\sum_{i} p_i\ln p_i \approx 1.192189. \]
Rounded to two decimal places, \[ \boxed{H \approx 1.19} \]
(for \emph{reptile diversity only). Quick Tip: The Shannon-Weaver Index (H) is a measure of diversity that accounts for both the number of species (richness) and their relative abundance (evenness). A higher H value indicates higher diversity. Pay close attention to which species should be included in the calculation based on the question's wording.
In haplodiploid organisms, males are haploid and females are diploid. Consider the relatedness diagram shown below. Female A has a full-sister, Y, who has a daughter, B. The relatedness between A and B is __________.
(Rounded off to three decimal places)

View Solution
We need to calculate the coefficient of relatedness (r) between an aunt (A) and her niece (B).
Relatedness is the probability that a randomly selected allele in one individual is identical by descent to a randomly selected allele in another individual.
The path of gene flow is from the parents of A and Y to A, and from the parents of A and Y to Y, and then from Y to her daughter B.
Let's denote the diploid mother of A and Y as 'M' and the haploid father as 'F'.
A and B are related through Y. B receives half her genes from her mother Y.
So, the relatedness between A and B is half of the relatedness between A and Y.
r\(_{AB}\) = (1/2) r\(_{AY}\).
Now we need to find the relatedness between the full sisters A and Y.
A and Y share the same mother (M) and the same father (F).
The probability of sharing an allele from the diploid mother is 1/2. So they share (1/2)(1/2) = 1/4 of their genes through their mother.
The father (F) is haploid, so he gives his entire set of genes to all his daughters. Thus, A and Y are 100% identical for the paternal half of their genomes. The probability of sharing an allele from the father is 1. They share (1/2)(1) = 1/2 of their genes through their father.
The total relatedness between full sisters (A and Y) is the sum of the maternal and paternal contributions.
r\(_{AY}\) = (1/4) + (1/2) = 3/4 = 0.75.
Finally, substitute this back to find the relatedness between aunt A and niece B.
r\(_{AB}\) = (1/2) r\(_{AY}\) = (1/2) (3/4) = 3/8.
As a decimal, 3/8 = 0.375.
Quick Tip: Relatedness calculations in haplodiploid systems are different from diploid systems. The key is that sisters share, on average, 75% of their genes (r=0.75) because they share 100% of their father's genes and 50% of their mother's genes.
Mixed species flocks of birds include social and solitary species. There are 5 social species and 10 solitary species in a forest. Flocks always have a total of 5 species, of which 2 are social and 3 are solitary. The number of types of flocks with unique species composition is __________.
(Answer in integer)
View Solution
This is a problem of combinations. We need to find the number of ways to form a flock with a specific composition.
A flock must have 2 social species and 3 solitary species.
First, we calculate the number of ways to choose the 2 social species from the available pool of 5 social species. The order of selection does not matter, so we use the combination formula \(^nC_r = \frac{n!}{r!(n-r)!}\).
Number of ways to choose social species = \(^5C_2 = \frac{5!}{2!(5-2)!} = \frac{5!}{2!3!} = \frac{5 \times 4}{2 \times 1} = 10\).
Next, we calculate the number of ways to choose the 3 solitary species from the available pool of 10 solitary species.
Number of ways to choose solitary species = \(^{10}C_3 = \frac{10!}{3!(10-3)!} = \frac{10!}{3!7!} = \frac{10 \times 9 \times 8}{3 \times 2 \times 1} = 10 \times 3 \times 4 = 120\).
To find the total number of unique flock compositions, we multiply the number of ways to choose the social species by the number of ways to choose the solitary species (the multiplication principle).
Total number of unique flocks = (Ways to choose social species) \(\times\) (Ways to choose solitary species)
Total = 10 \(\times\) 120 = 1200.
Quick Tip: When a problem asks you to form a group by selecting items from different categories, calculate the number of combinations for each category separately and then multiply the results together to get the total number of possible groups.
In a zoo, three lions and four tigers eat 390 kg of food every week. In another zoo, four lions and five tigers eat 500 kg of food every week. Lions and tigers eat different amounts of food, but all individuals of the same species eat the same amount. The amount of food a single lion eats per week is __________ kg.
(Answer in integer)
View Solution
This problem can be solved by setting up a system of two linear equations with two variables.
Let L be the amount of food (in kg) a single lion eats per week.
Let T be the amount of food (in kg) a single tiger eats per week.
From the information given for the first zoo, we can write the first equation:
Equation 1: 3L + 4T = 390
From the information given for the second zoo, we can write the second equation:
Equation 2: 4L + 5T = 500
Now we need to solve this system of equations for L. We can use the method of elimination.
Multiply Equation 1 by 5 and Equation 2 by 4 to make the coefficients of T equal.
5 \(\times\) (3L + 4T = 390) => 15L + 20T = 1950
4 \(\times\) (4L + 5T = 500) => 16L + 20T = 2000
Now, subtract the new first equation from the new second equation to eliminate T.
(16L + 20T) - (15L + 20T) = 2000 - 1950
16L - 15L = 50
L = 50.
The amount of food a single lion eats per week is 50 kg.
We can also find T to check our work. Substitute L=50 into Equation 1:
3(50) + 4T = 390
150 + 4T = 390
4T = 240
T = 60.
Check with Equation 2: 4(50) + 5(60) = 200 + 300 = 500. It works.
Quick Tip: Word problems like this can often be translated into a system of linear equations. Identify the unknown quantities, assign variables to them, and write one equation for each piece of independent information provided.

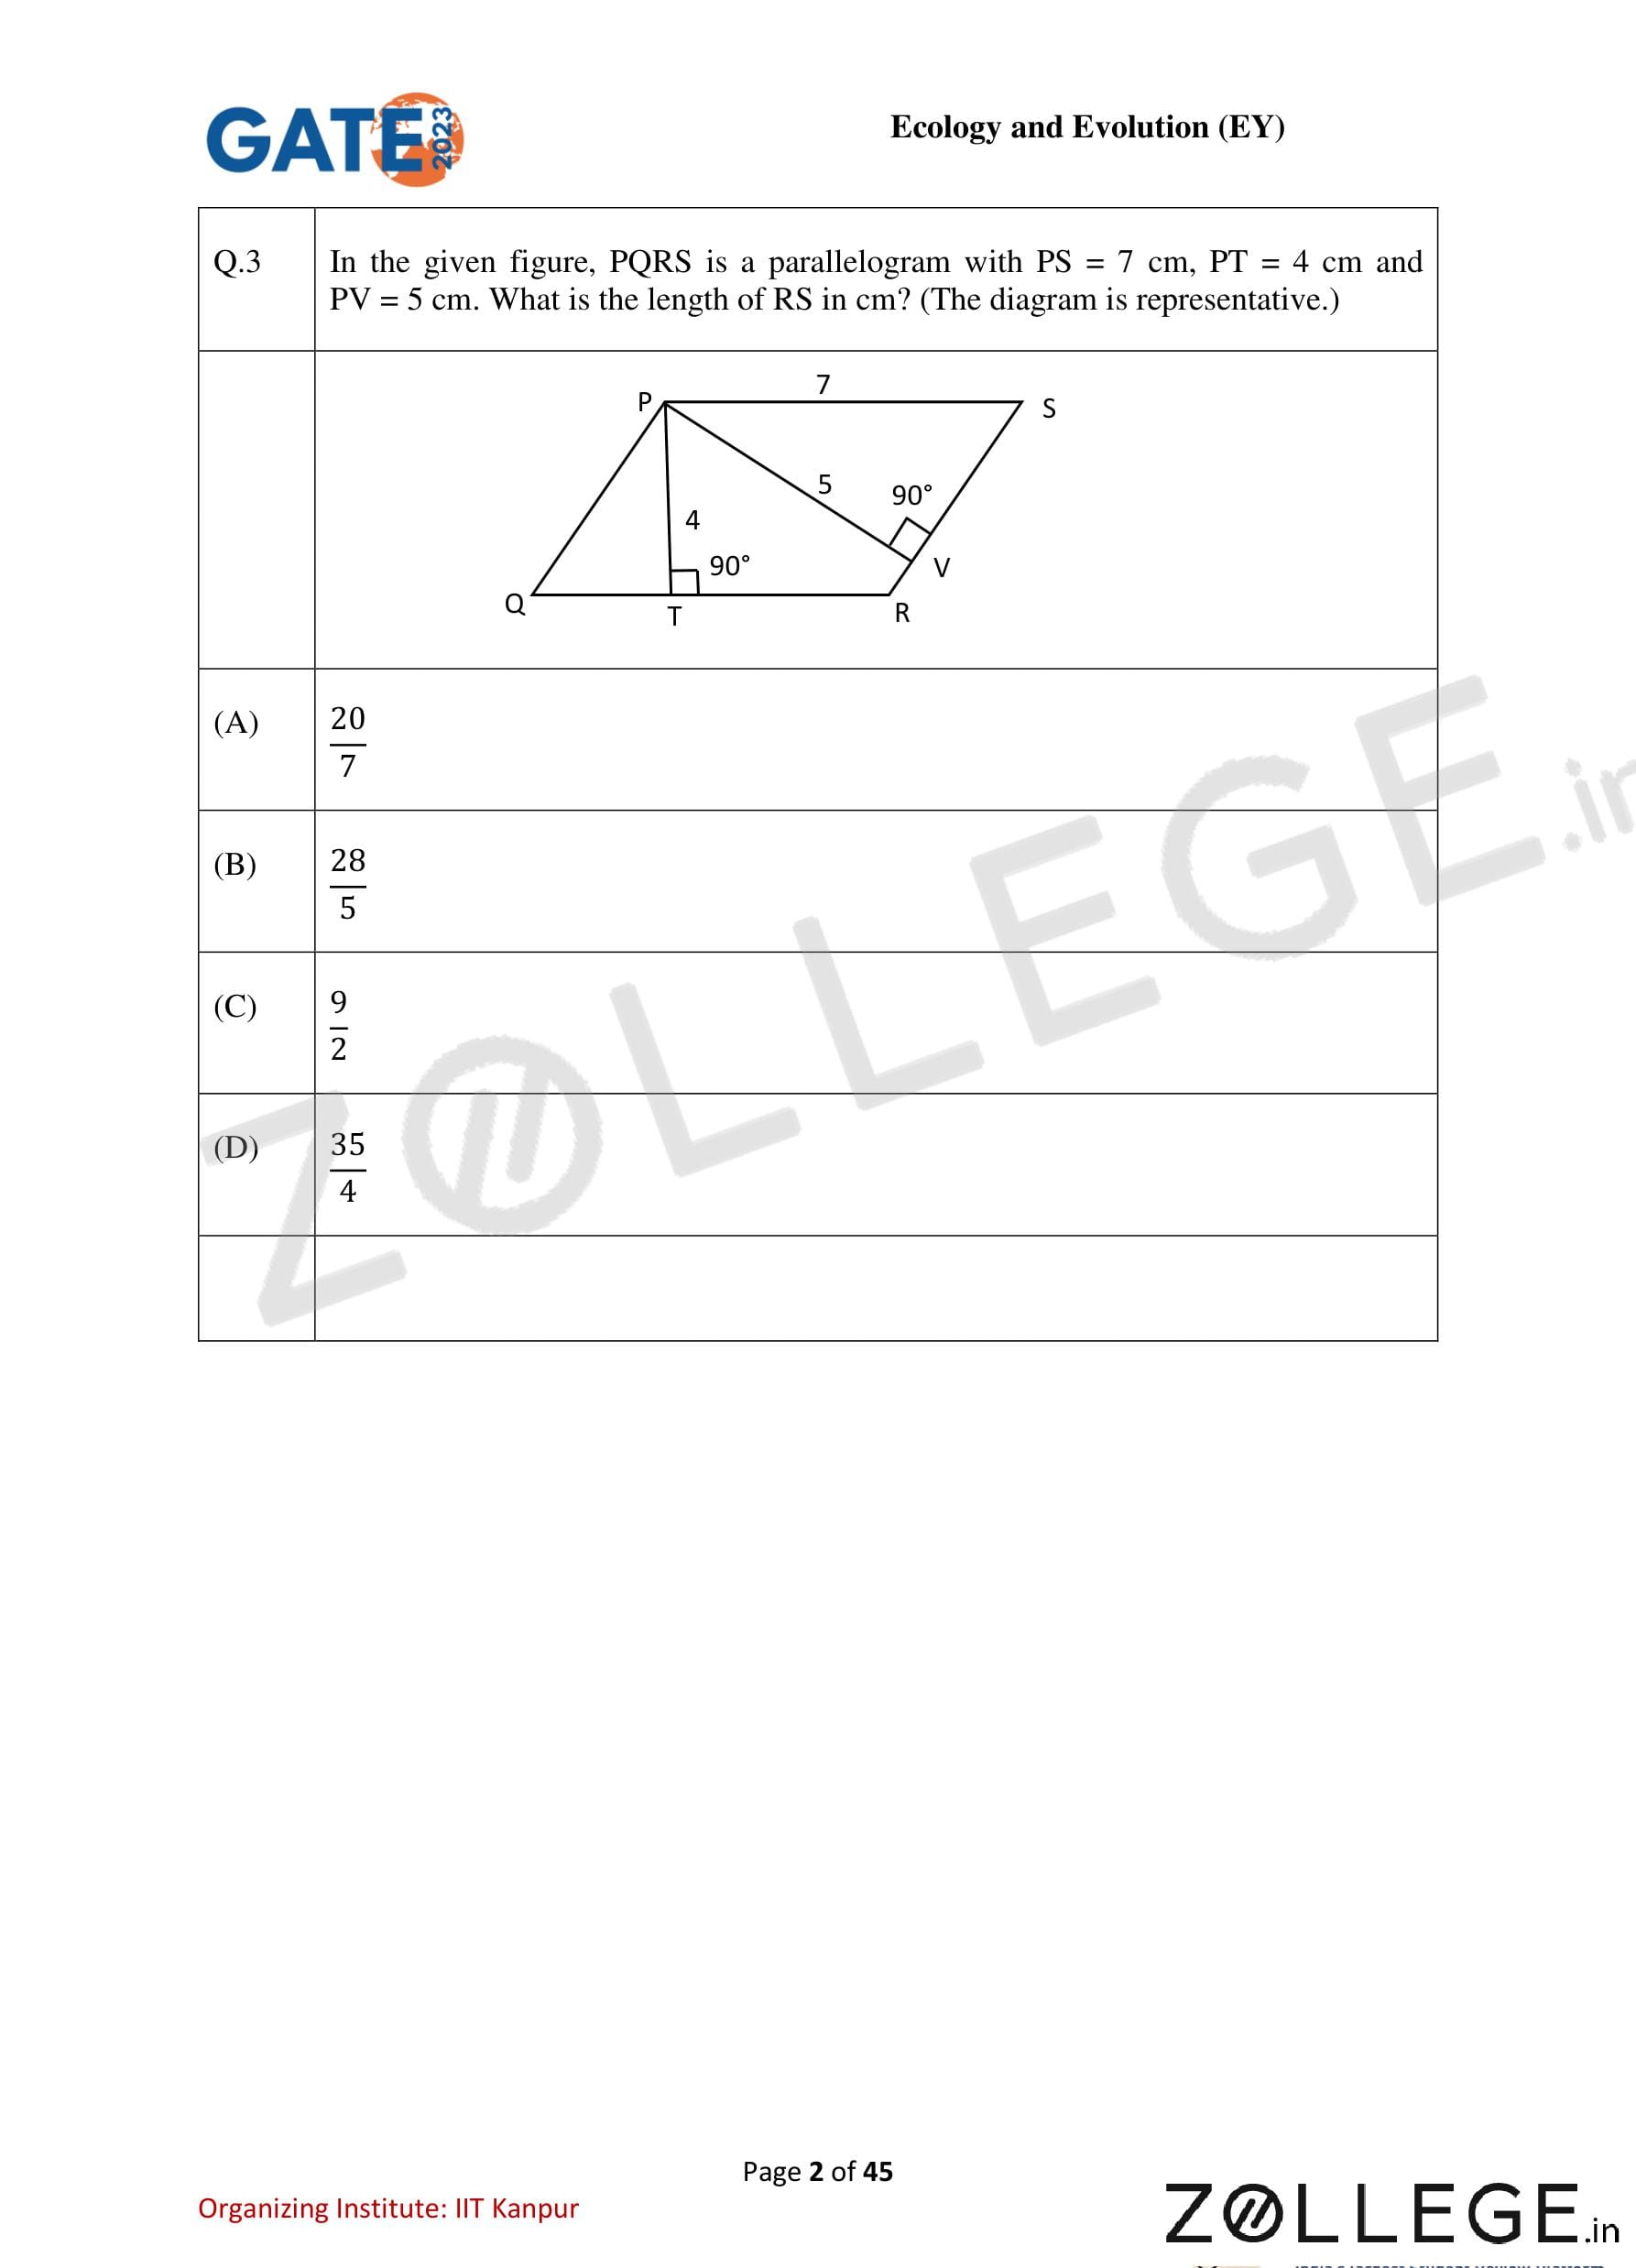
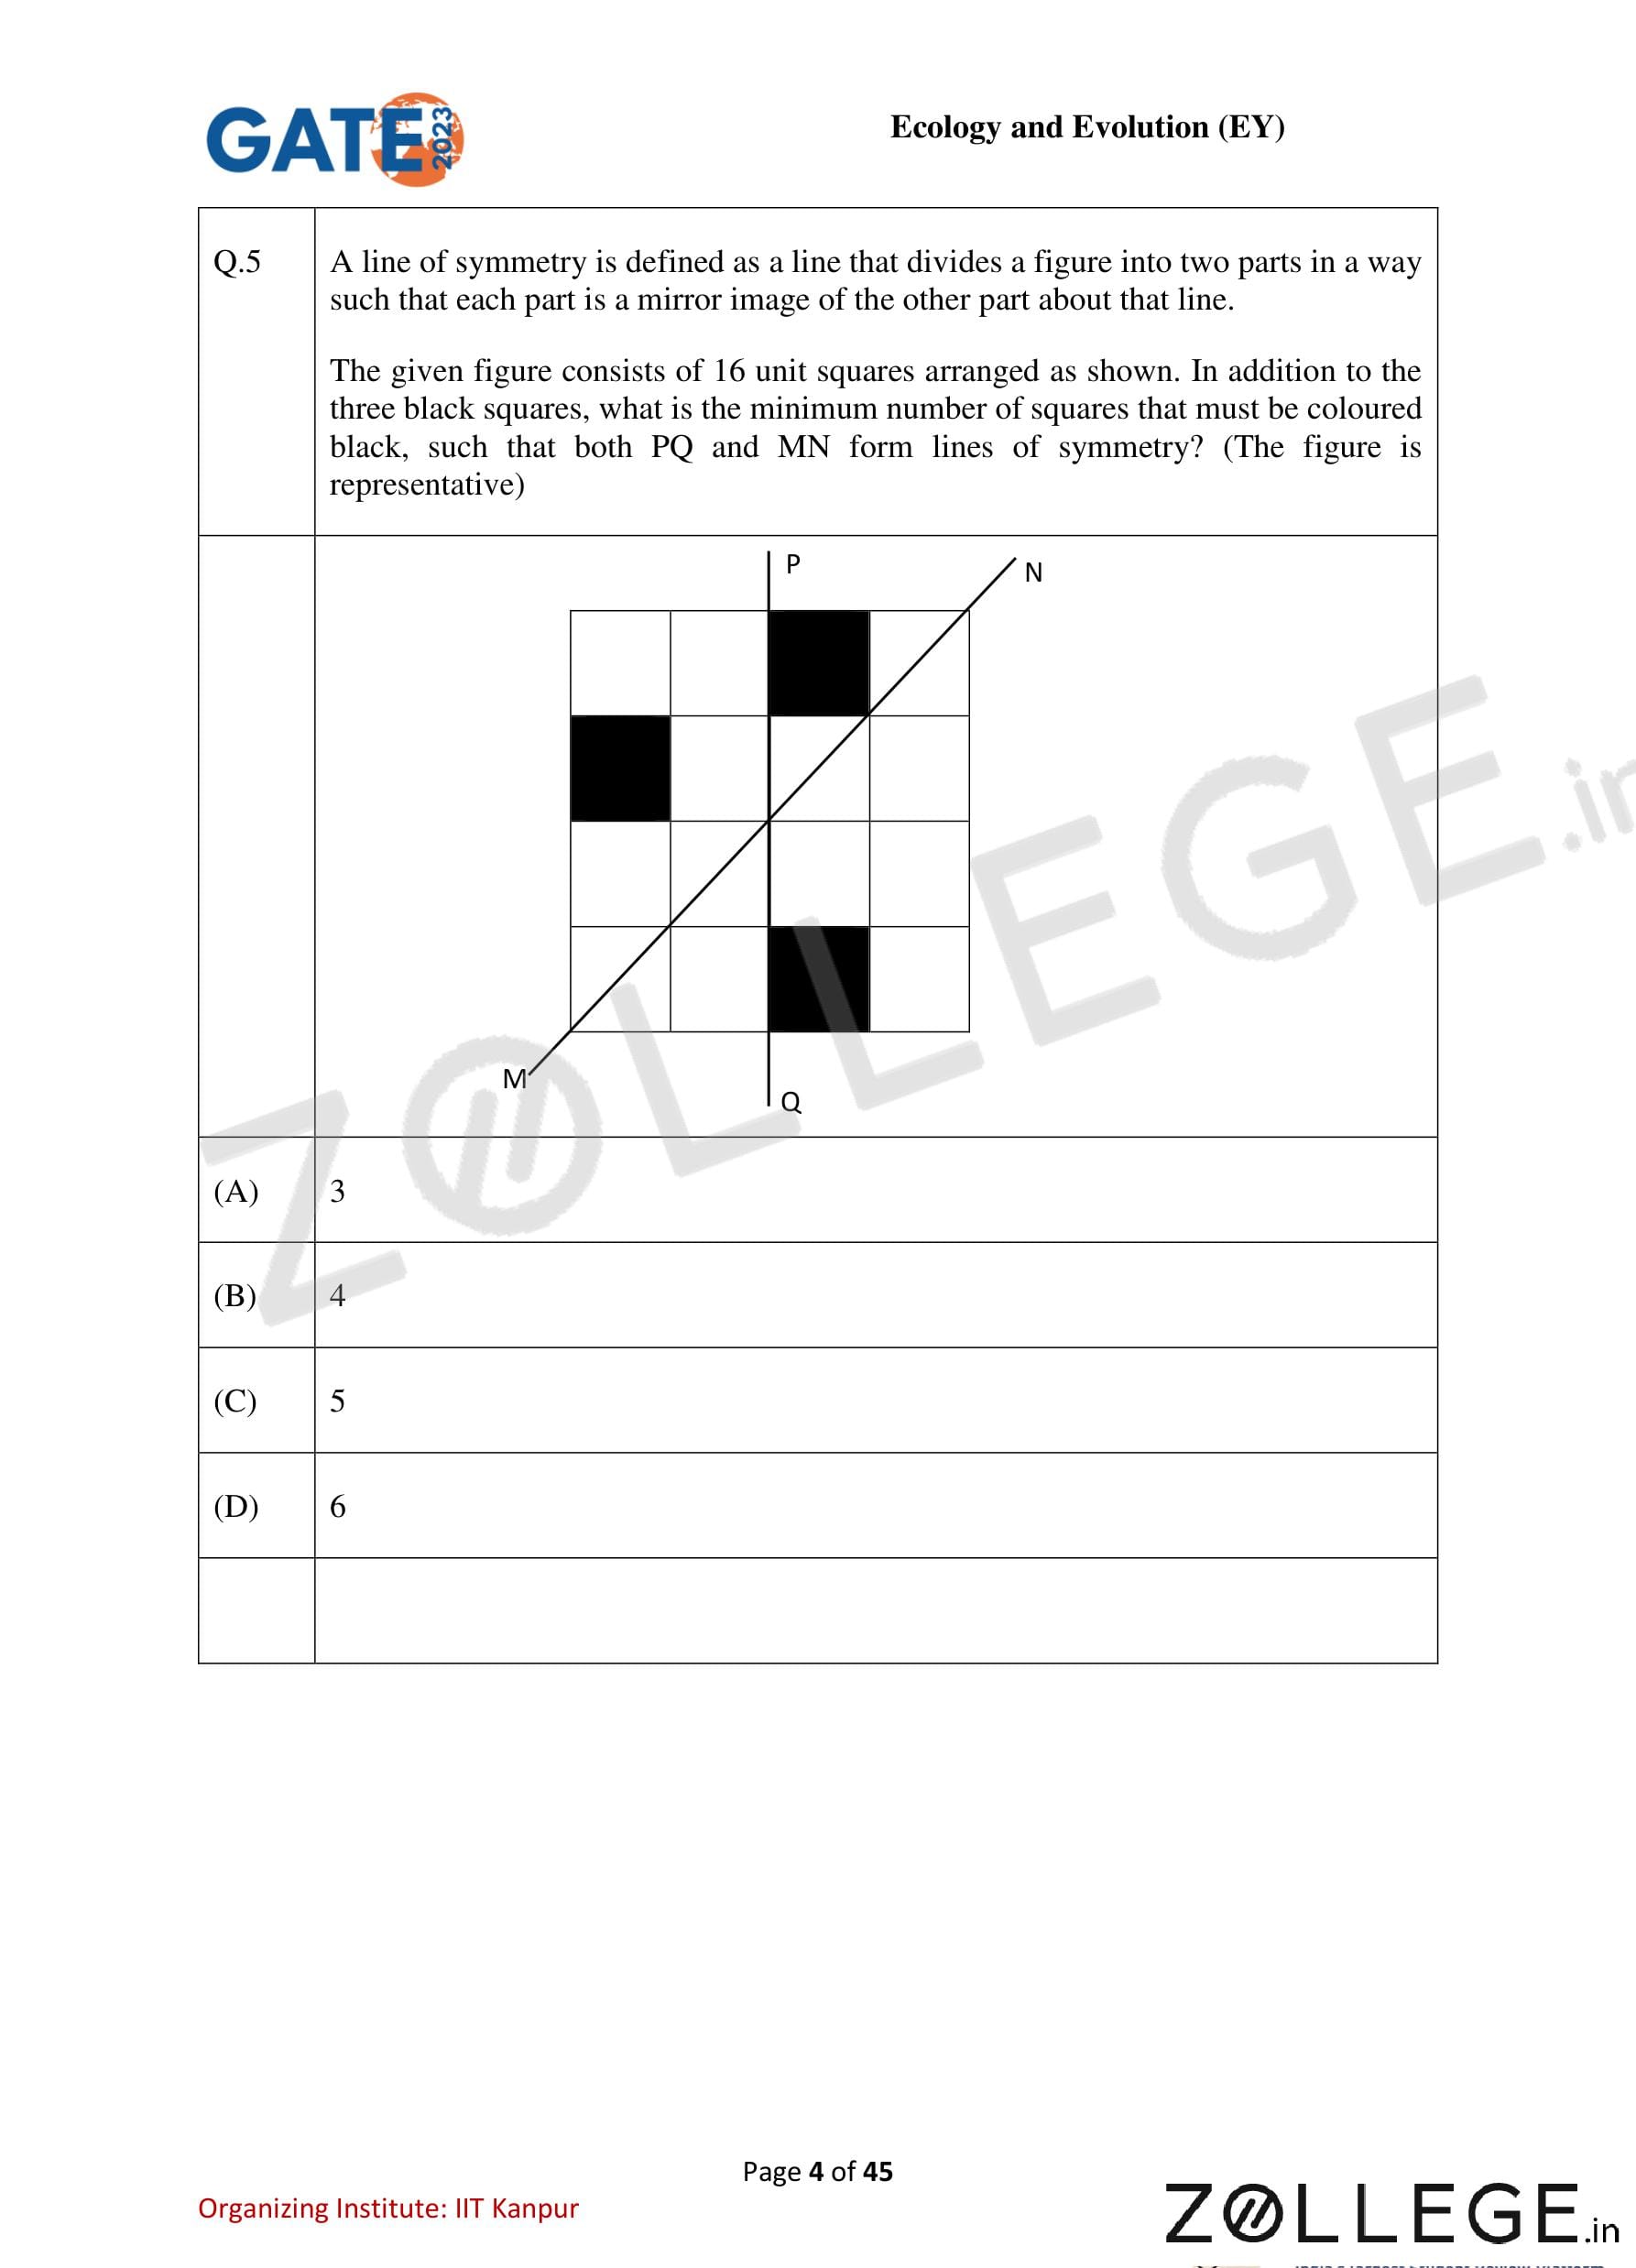
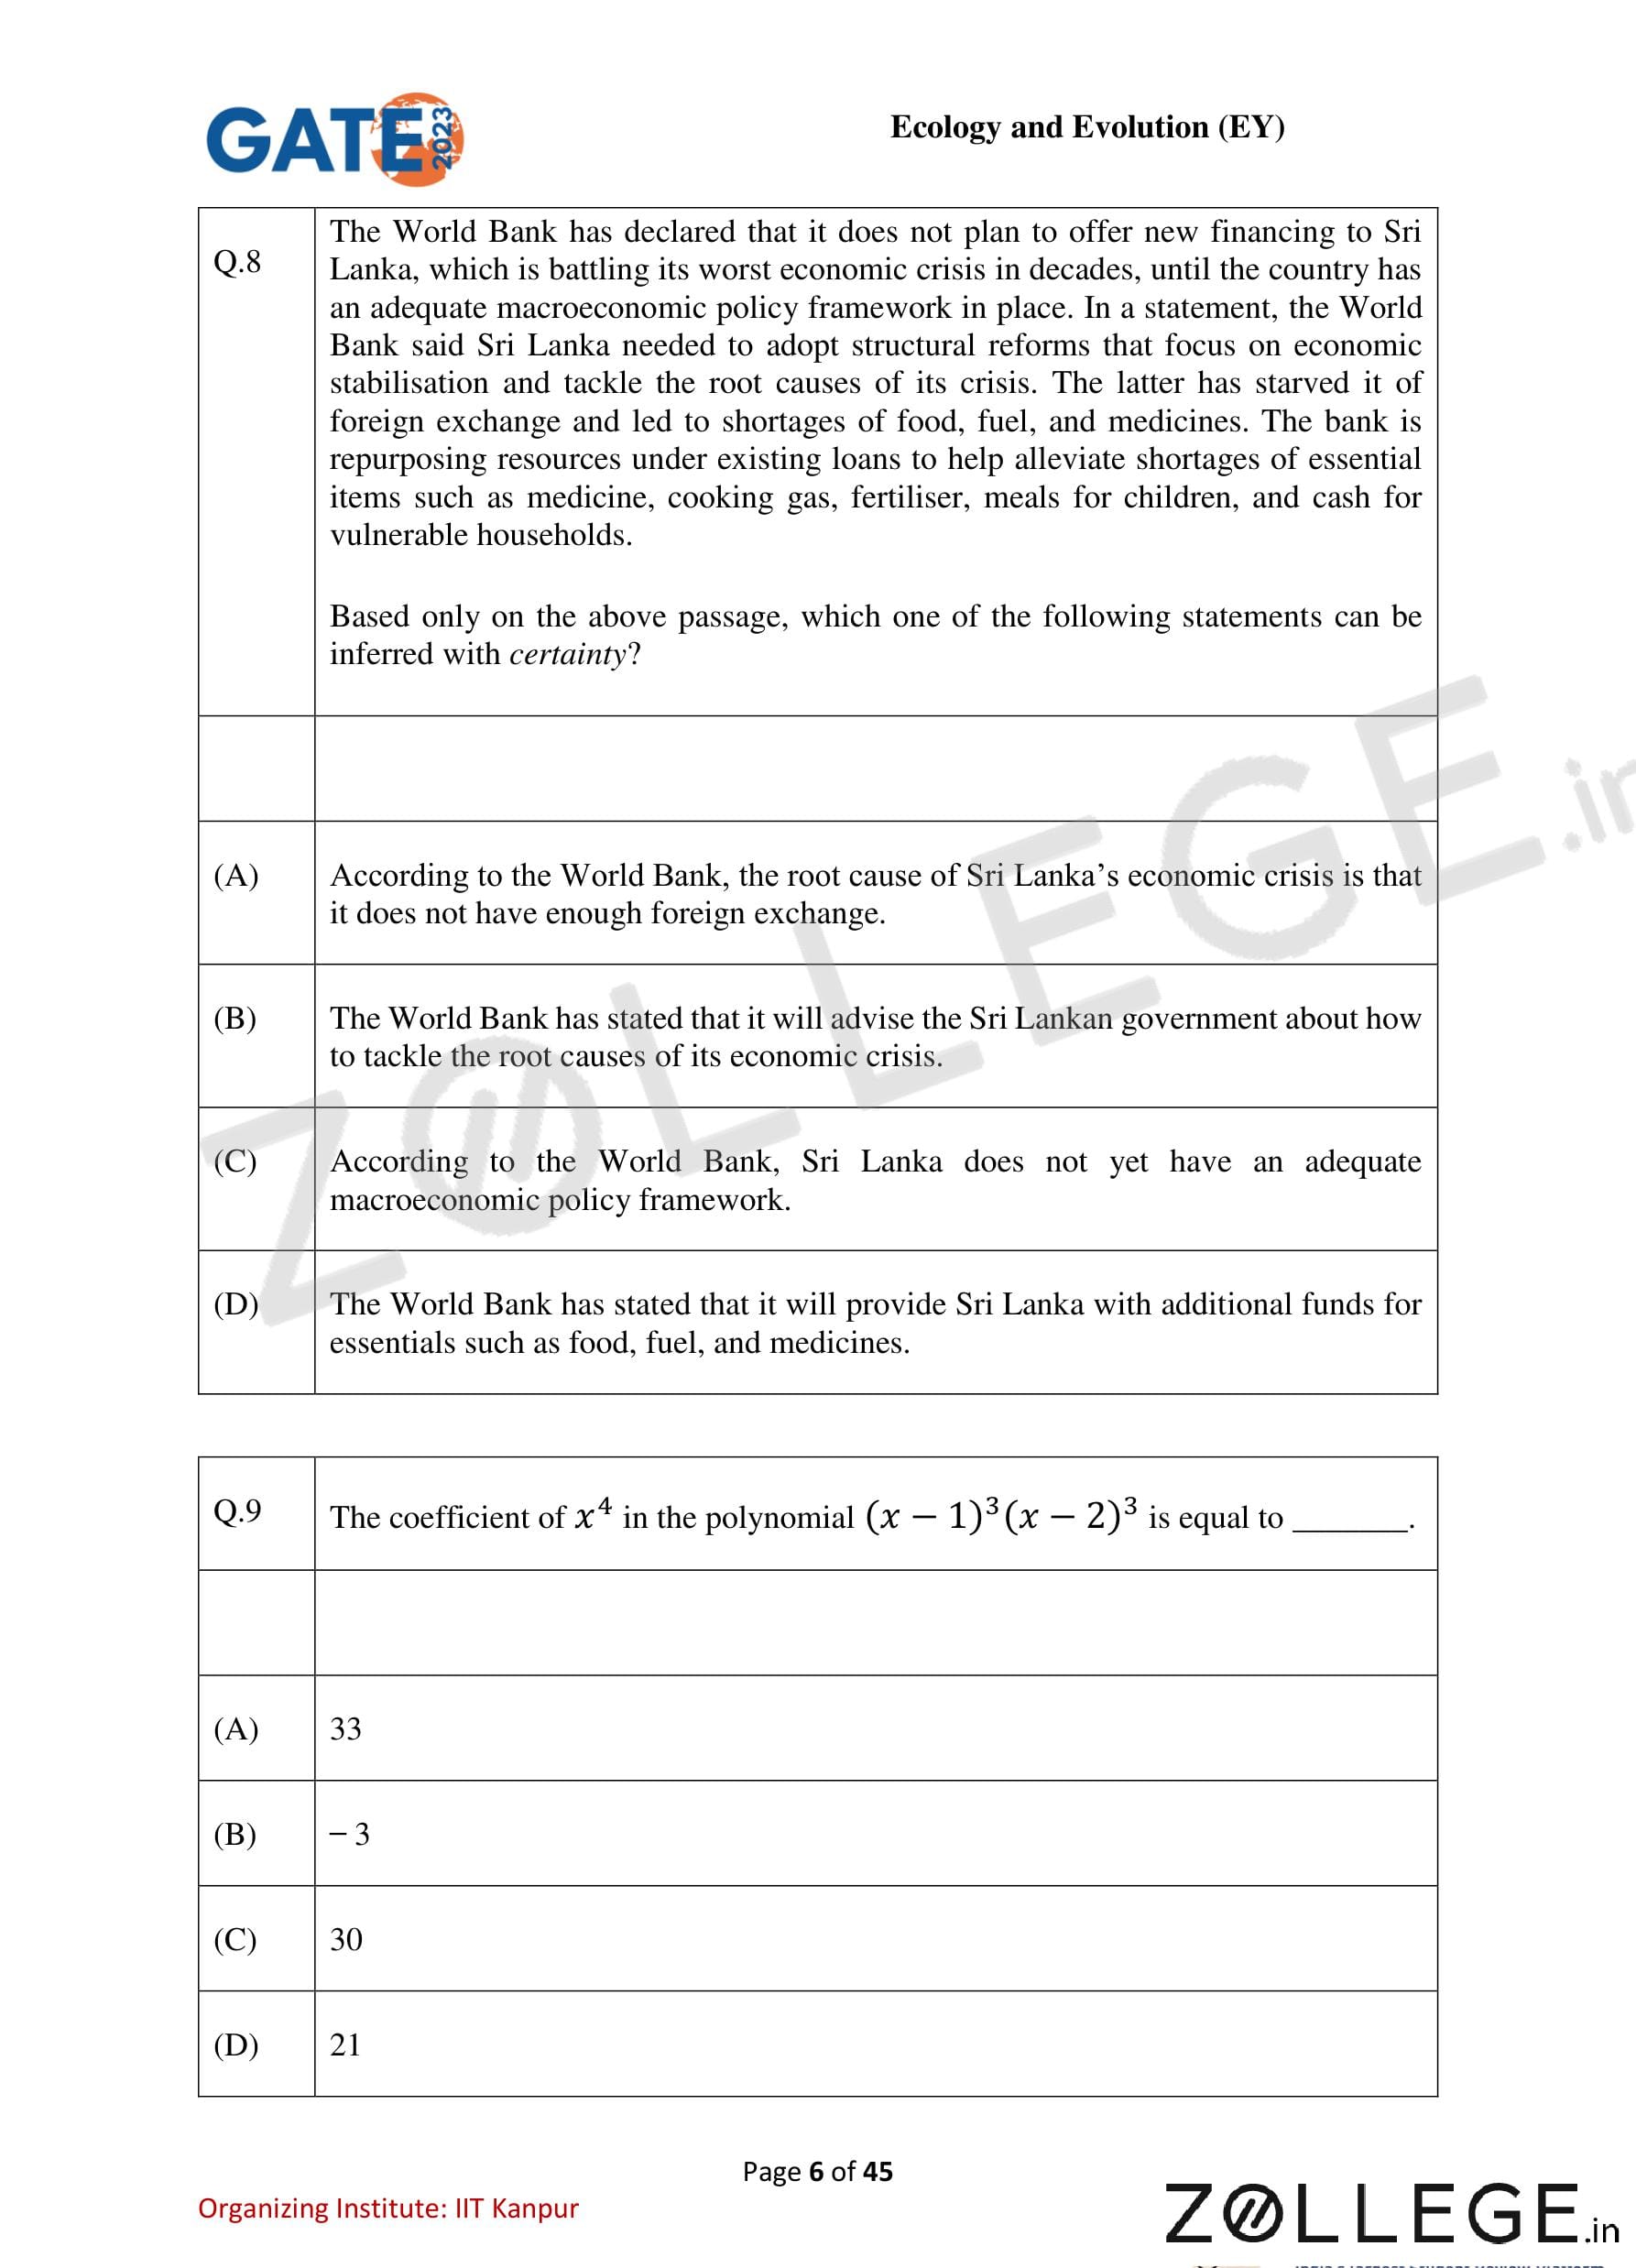
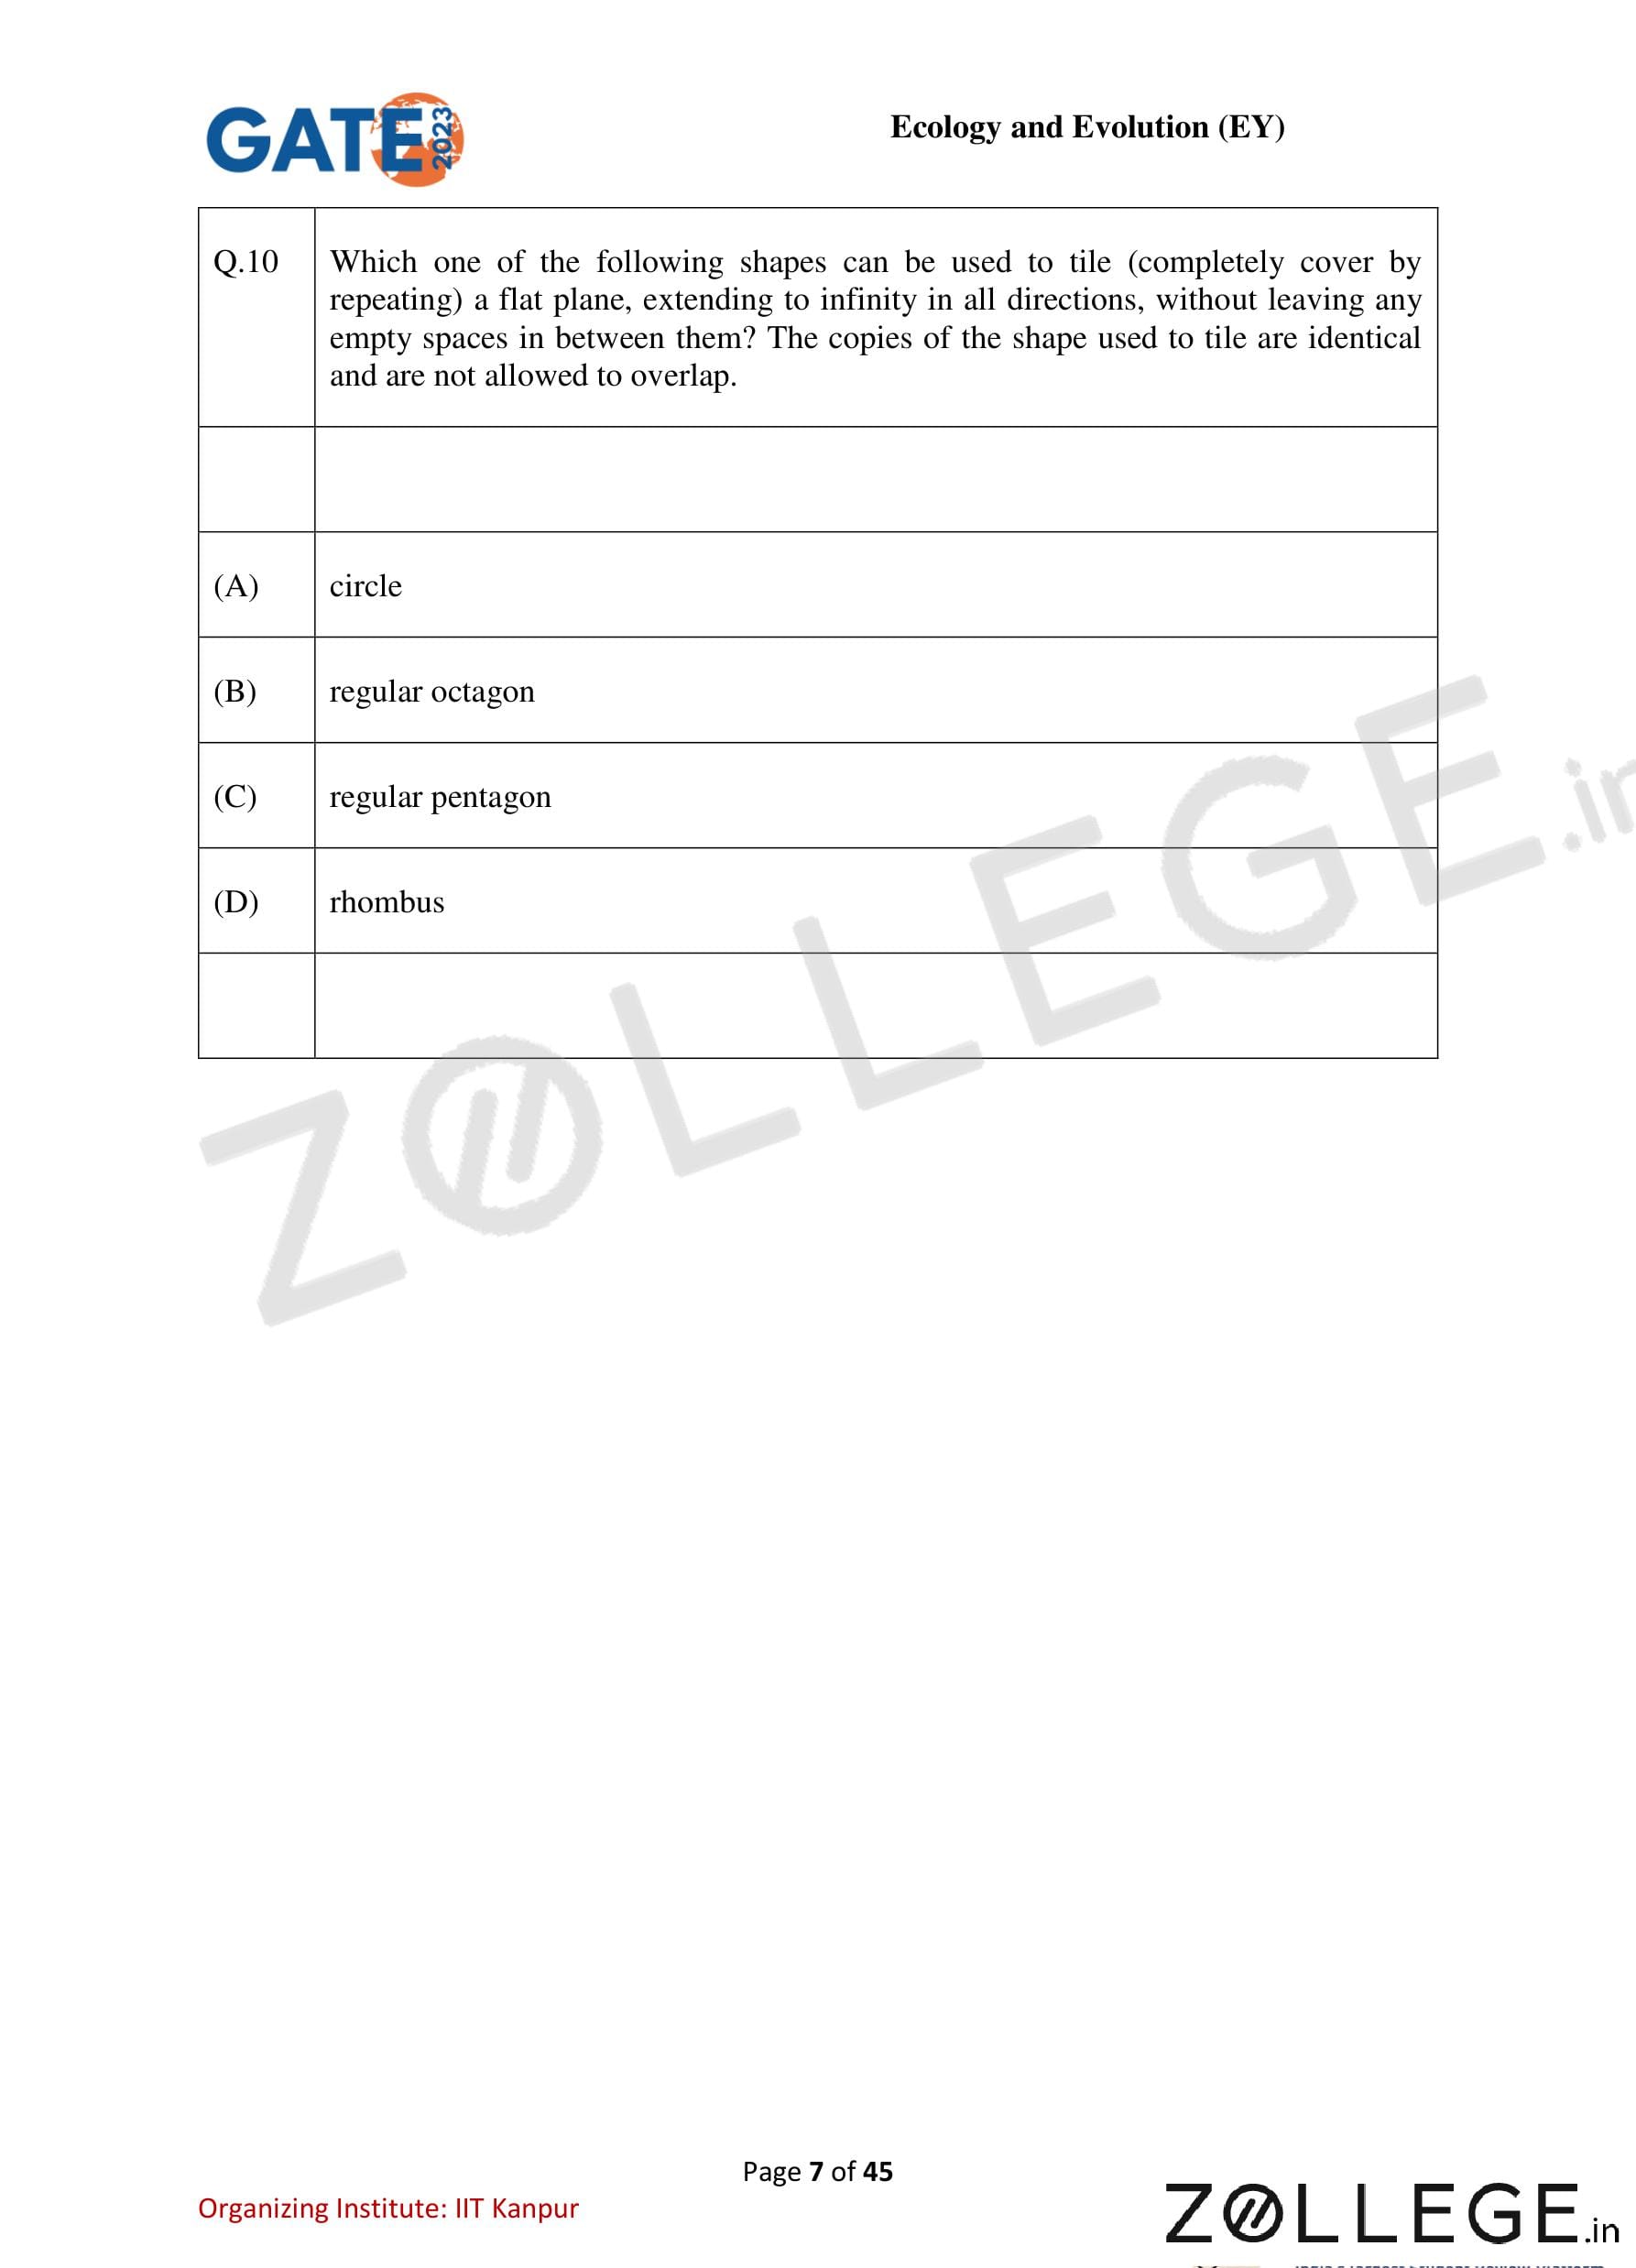

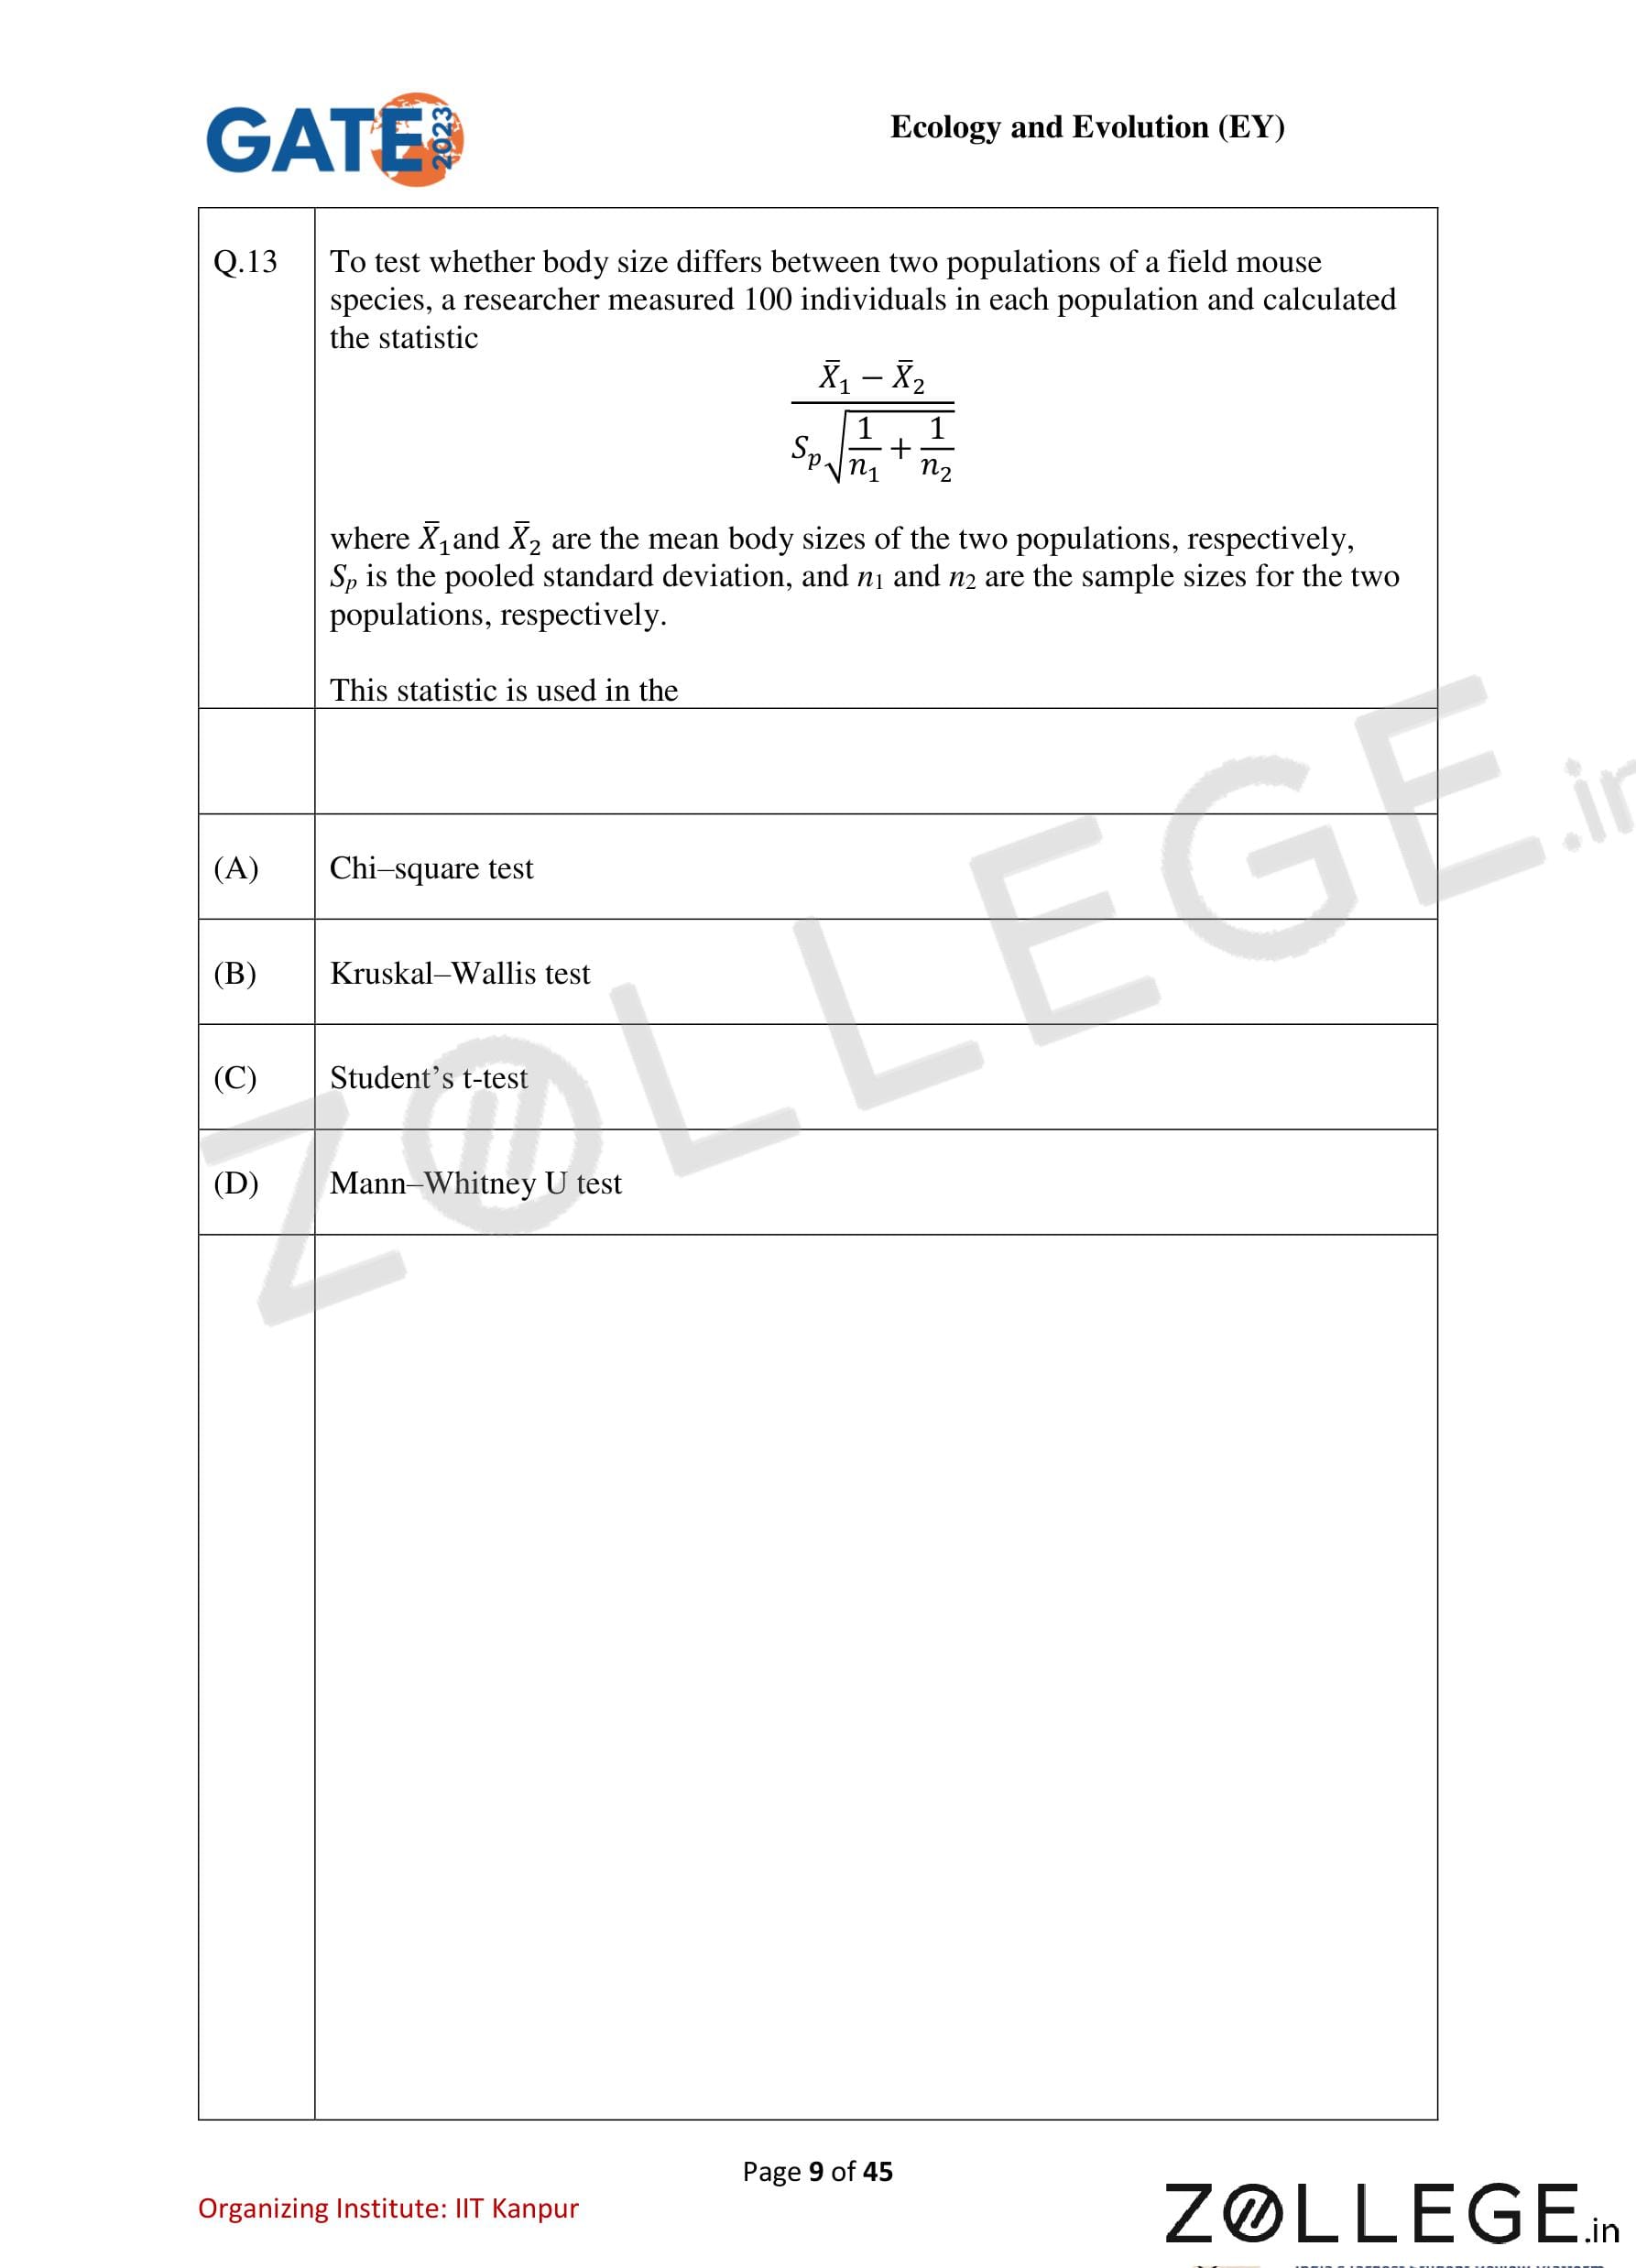
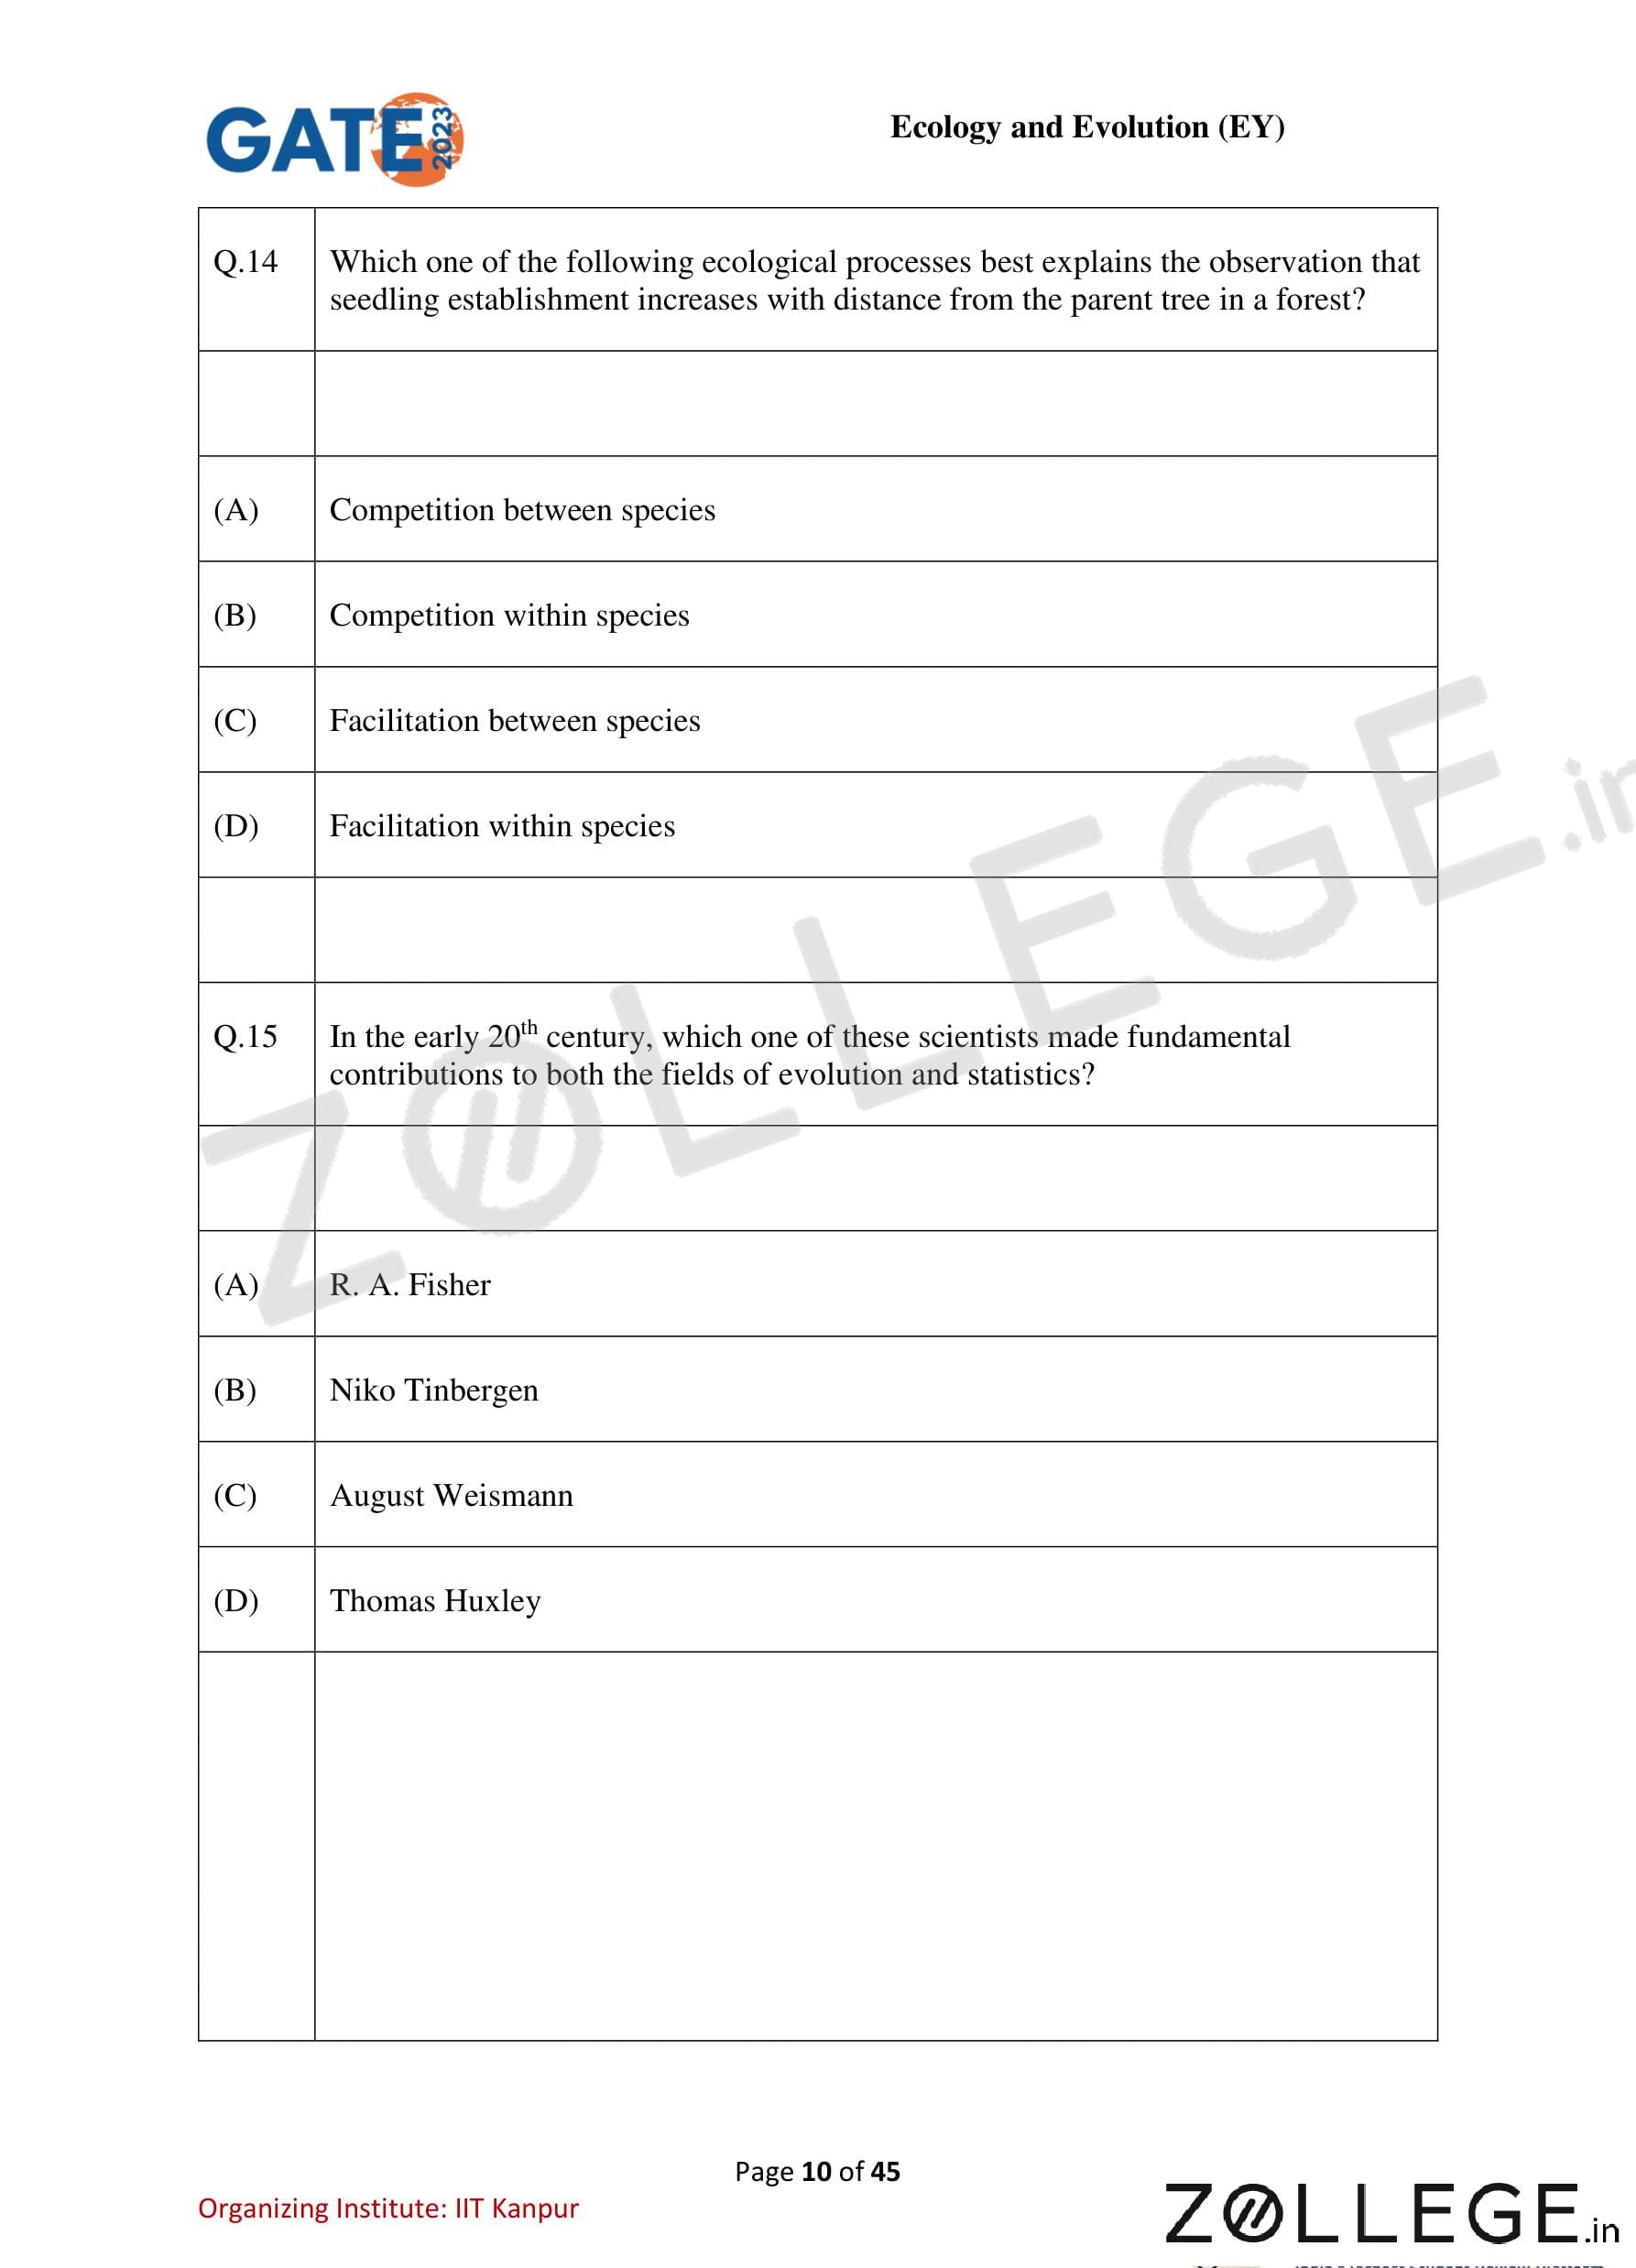
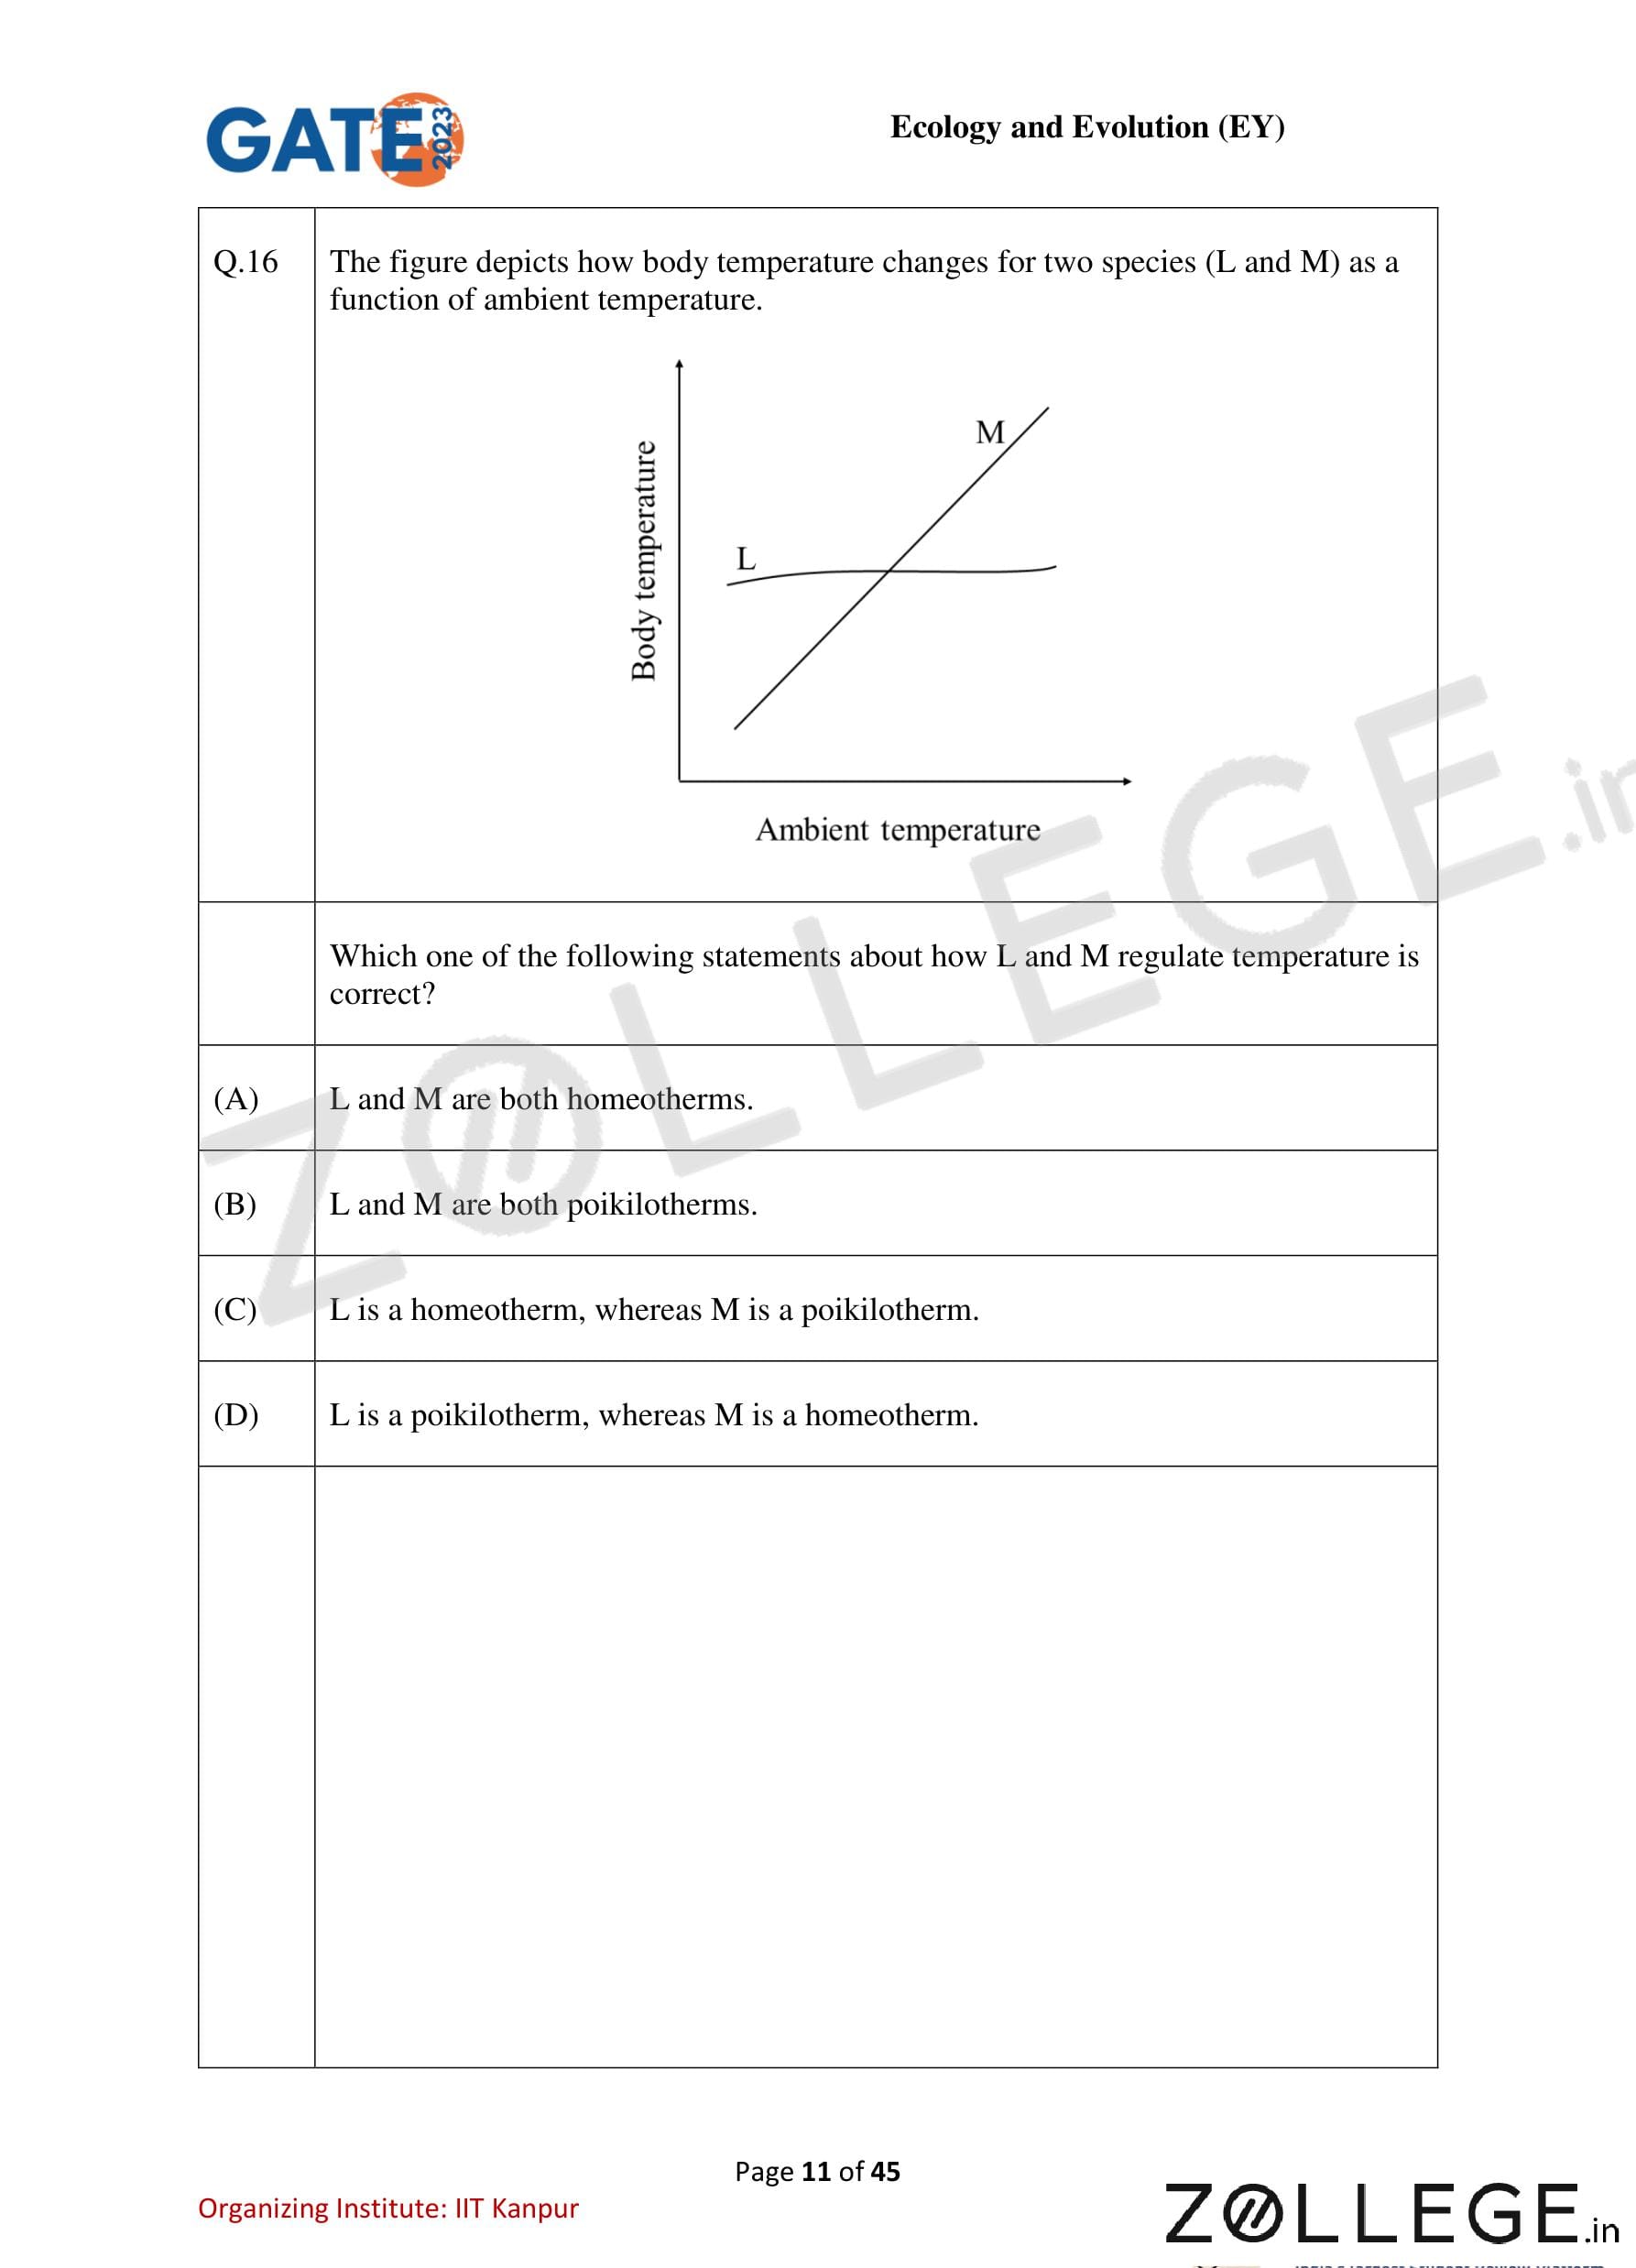

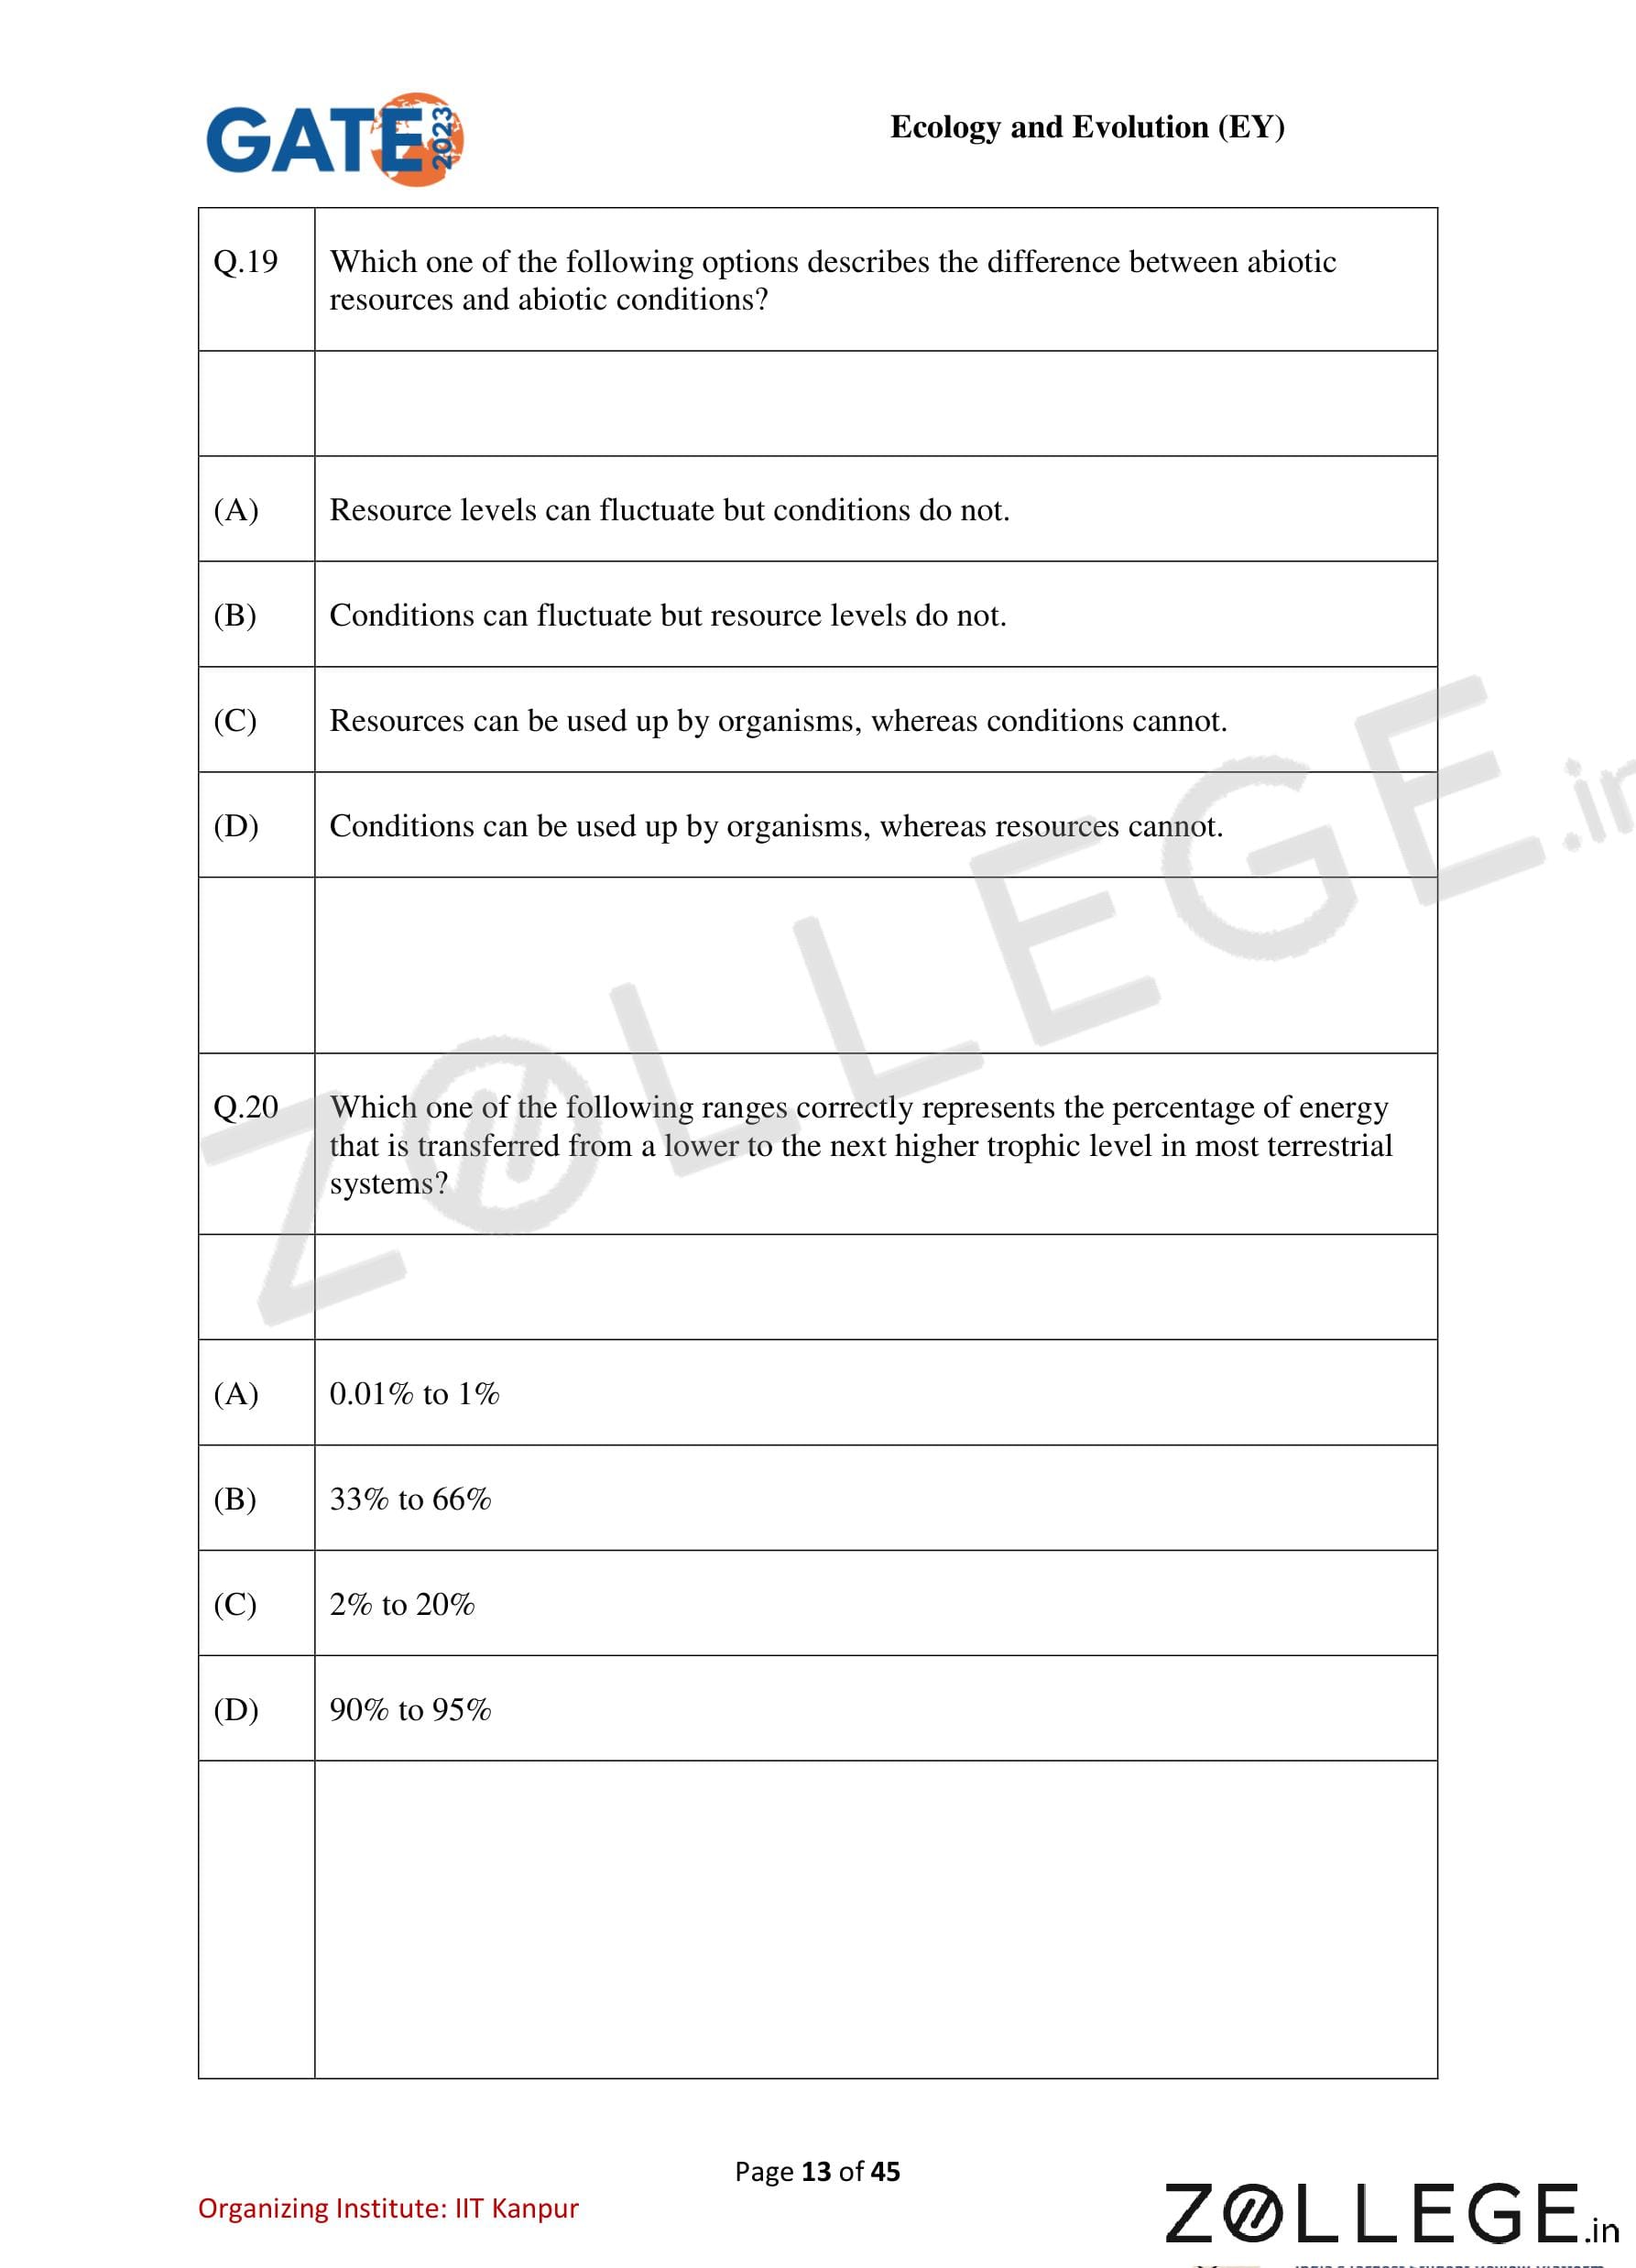
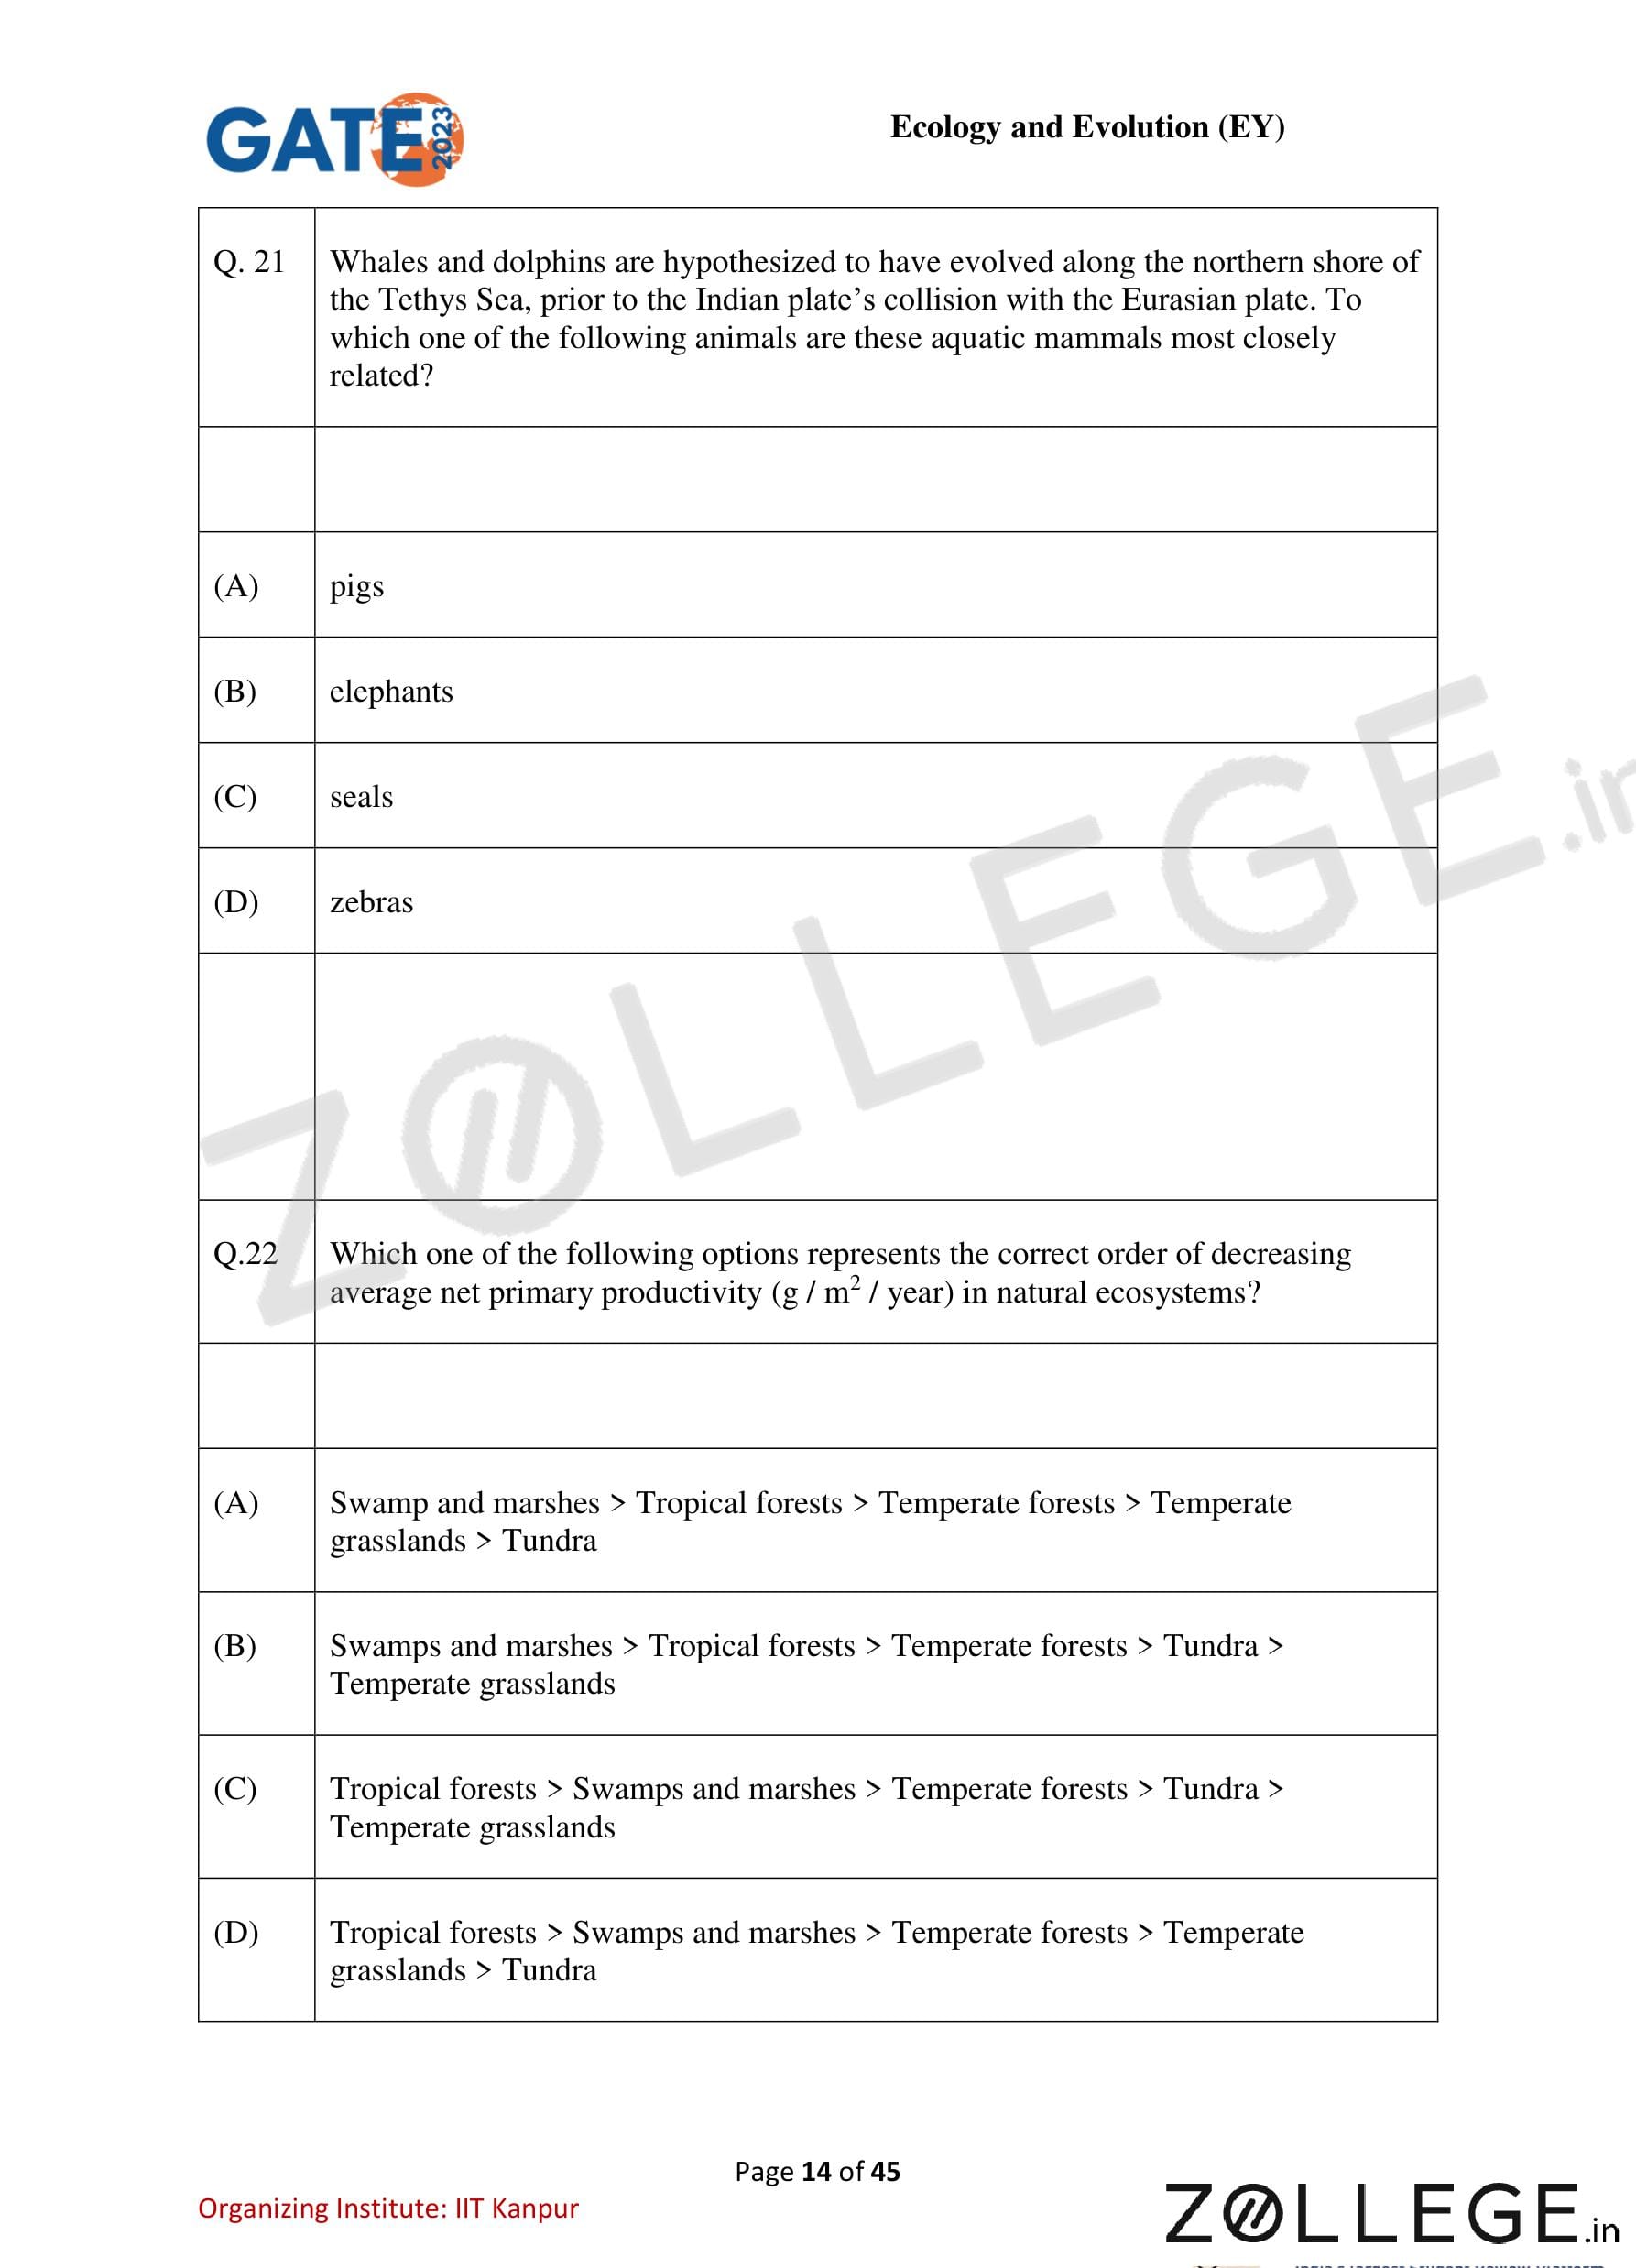
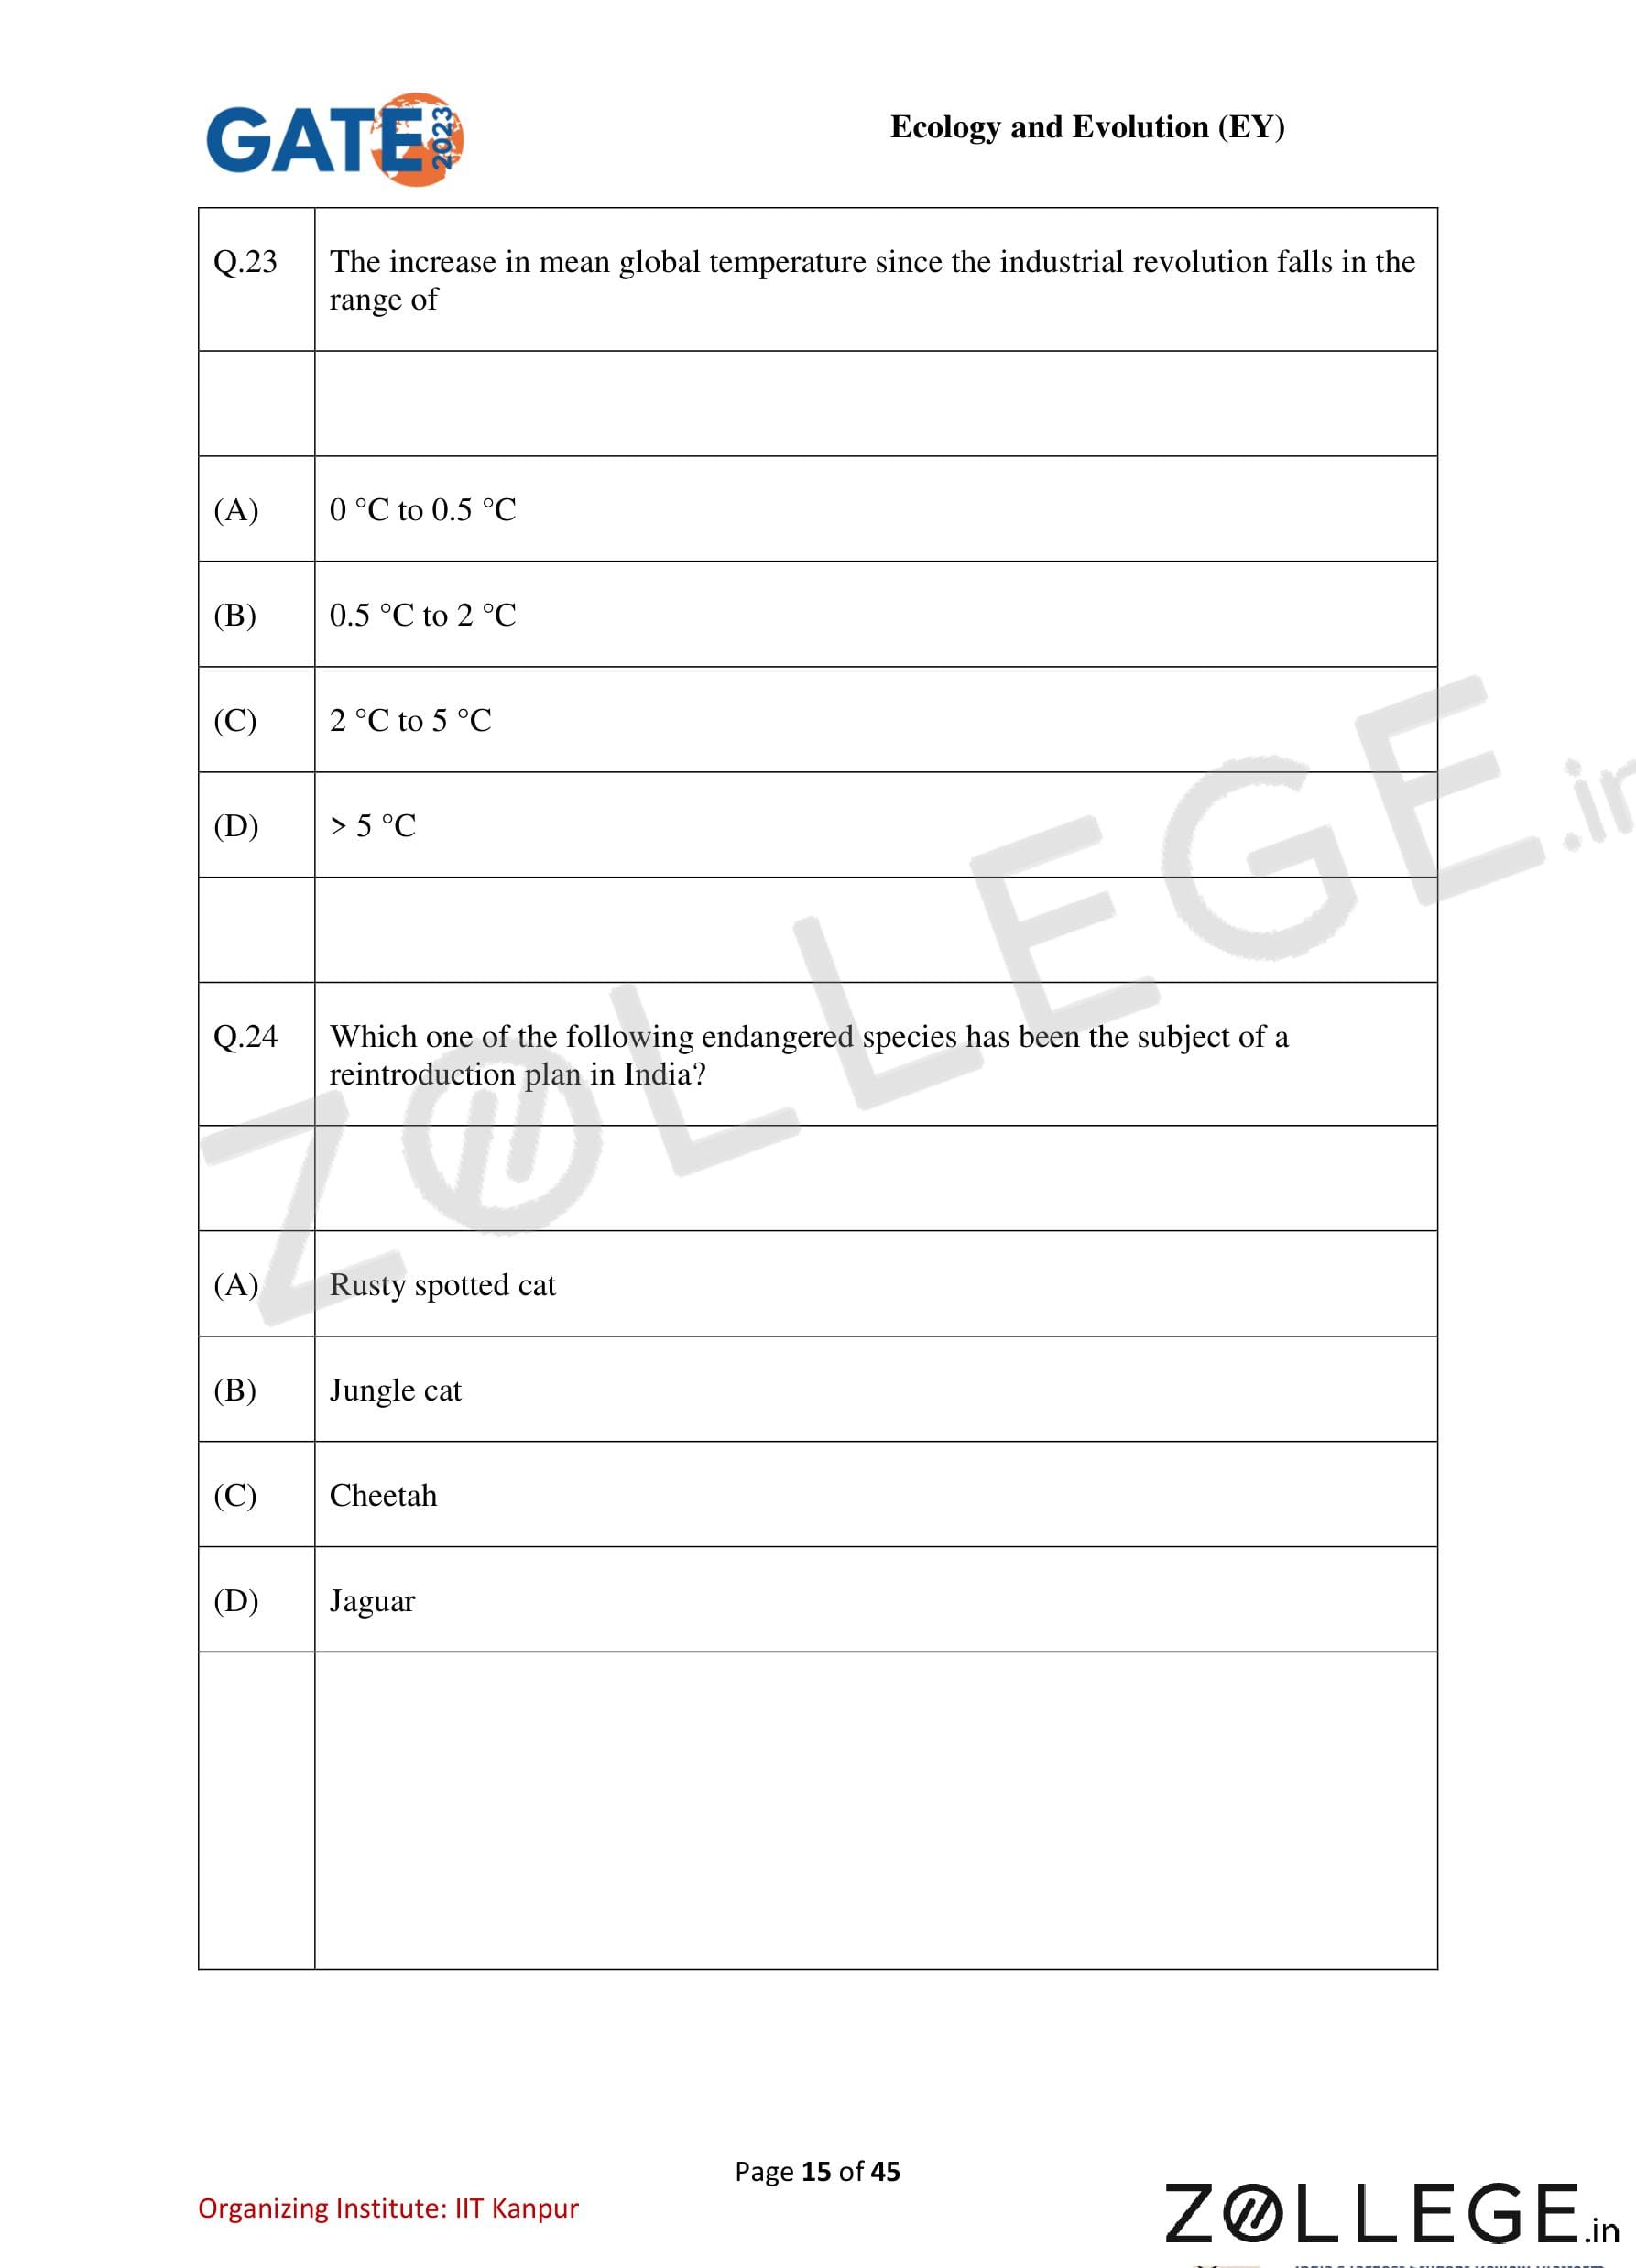

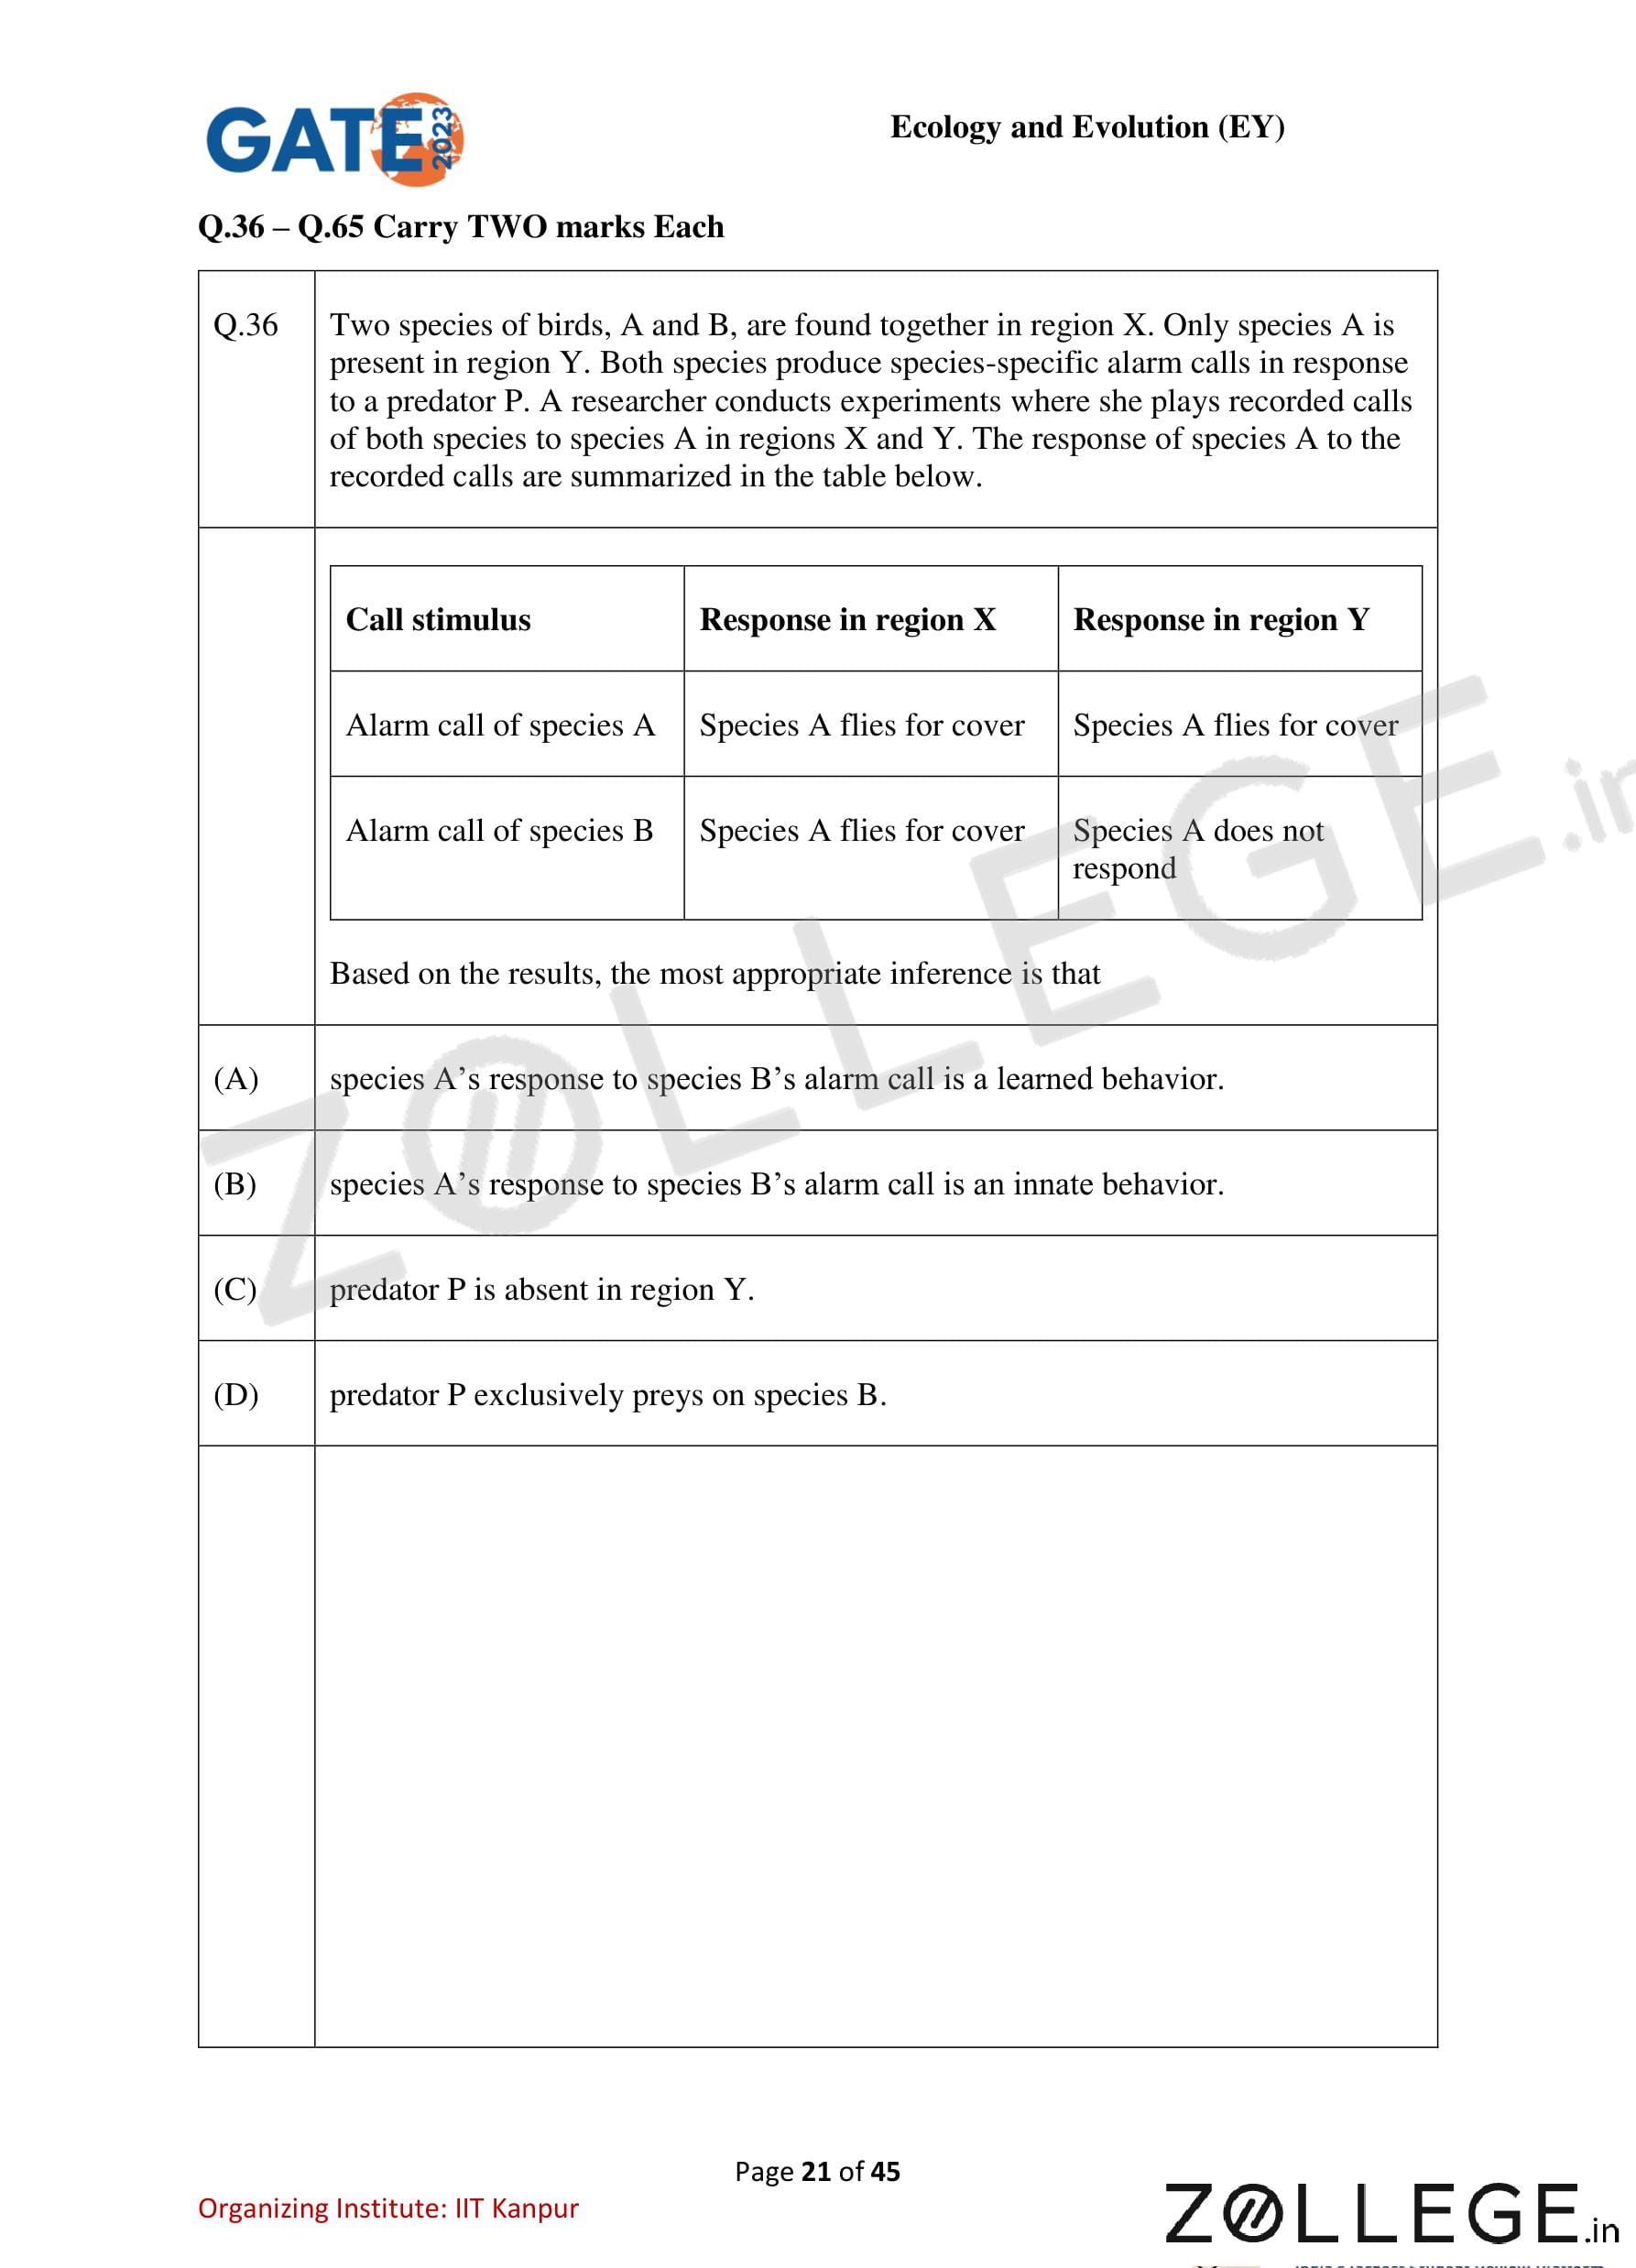
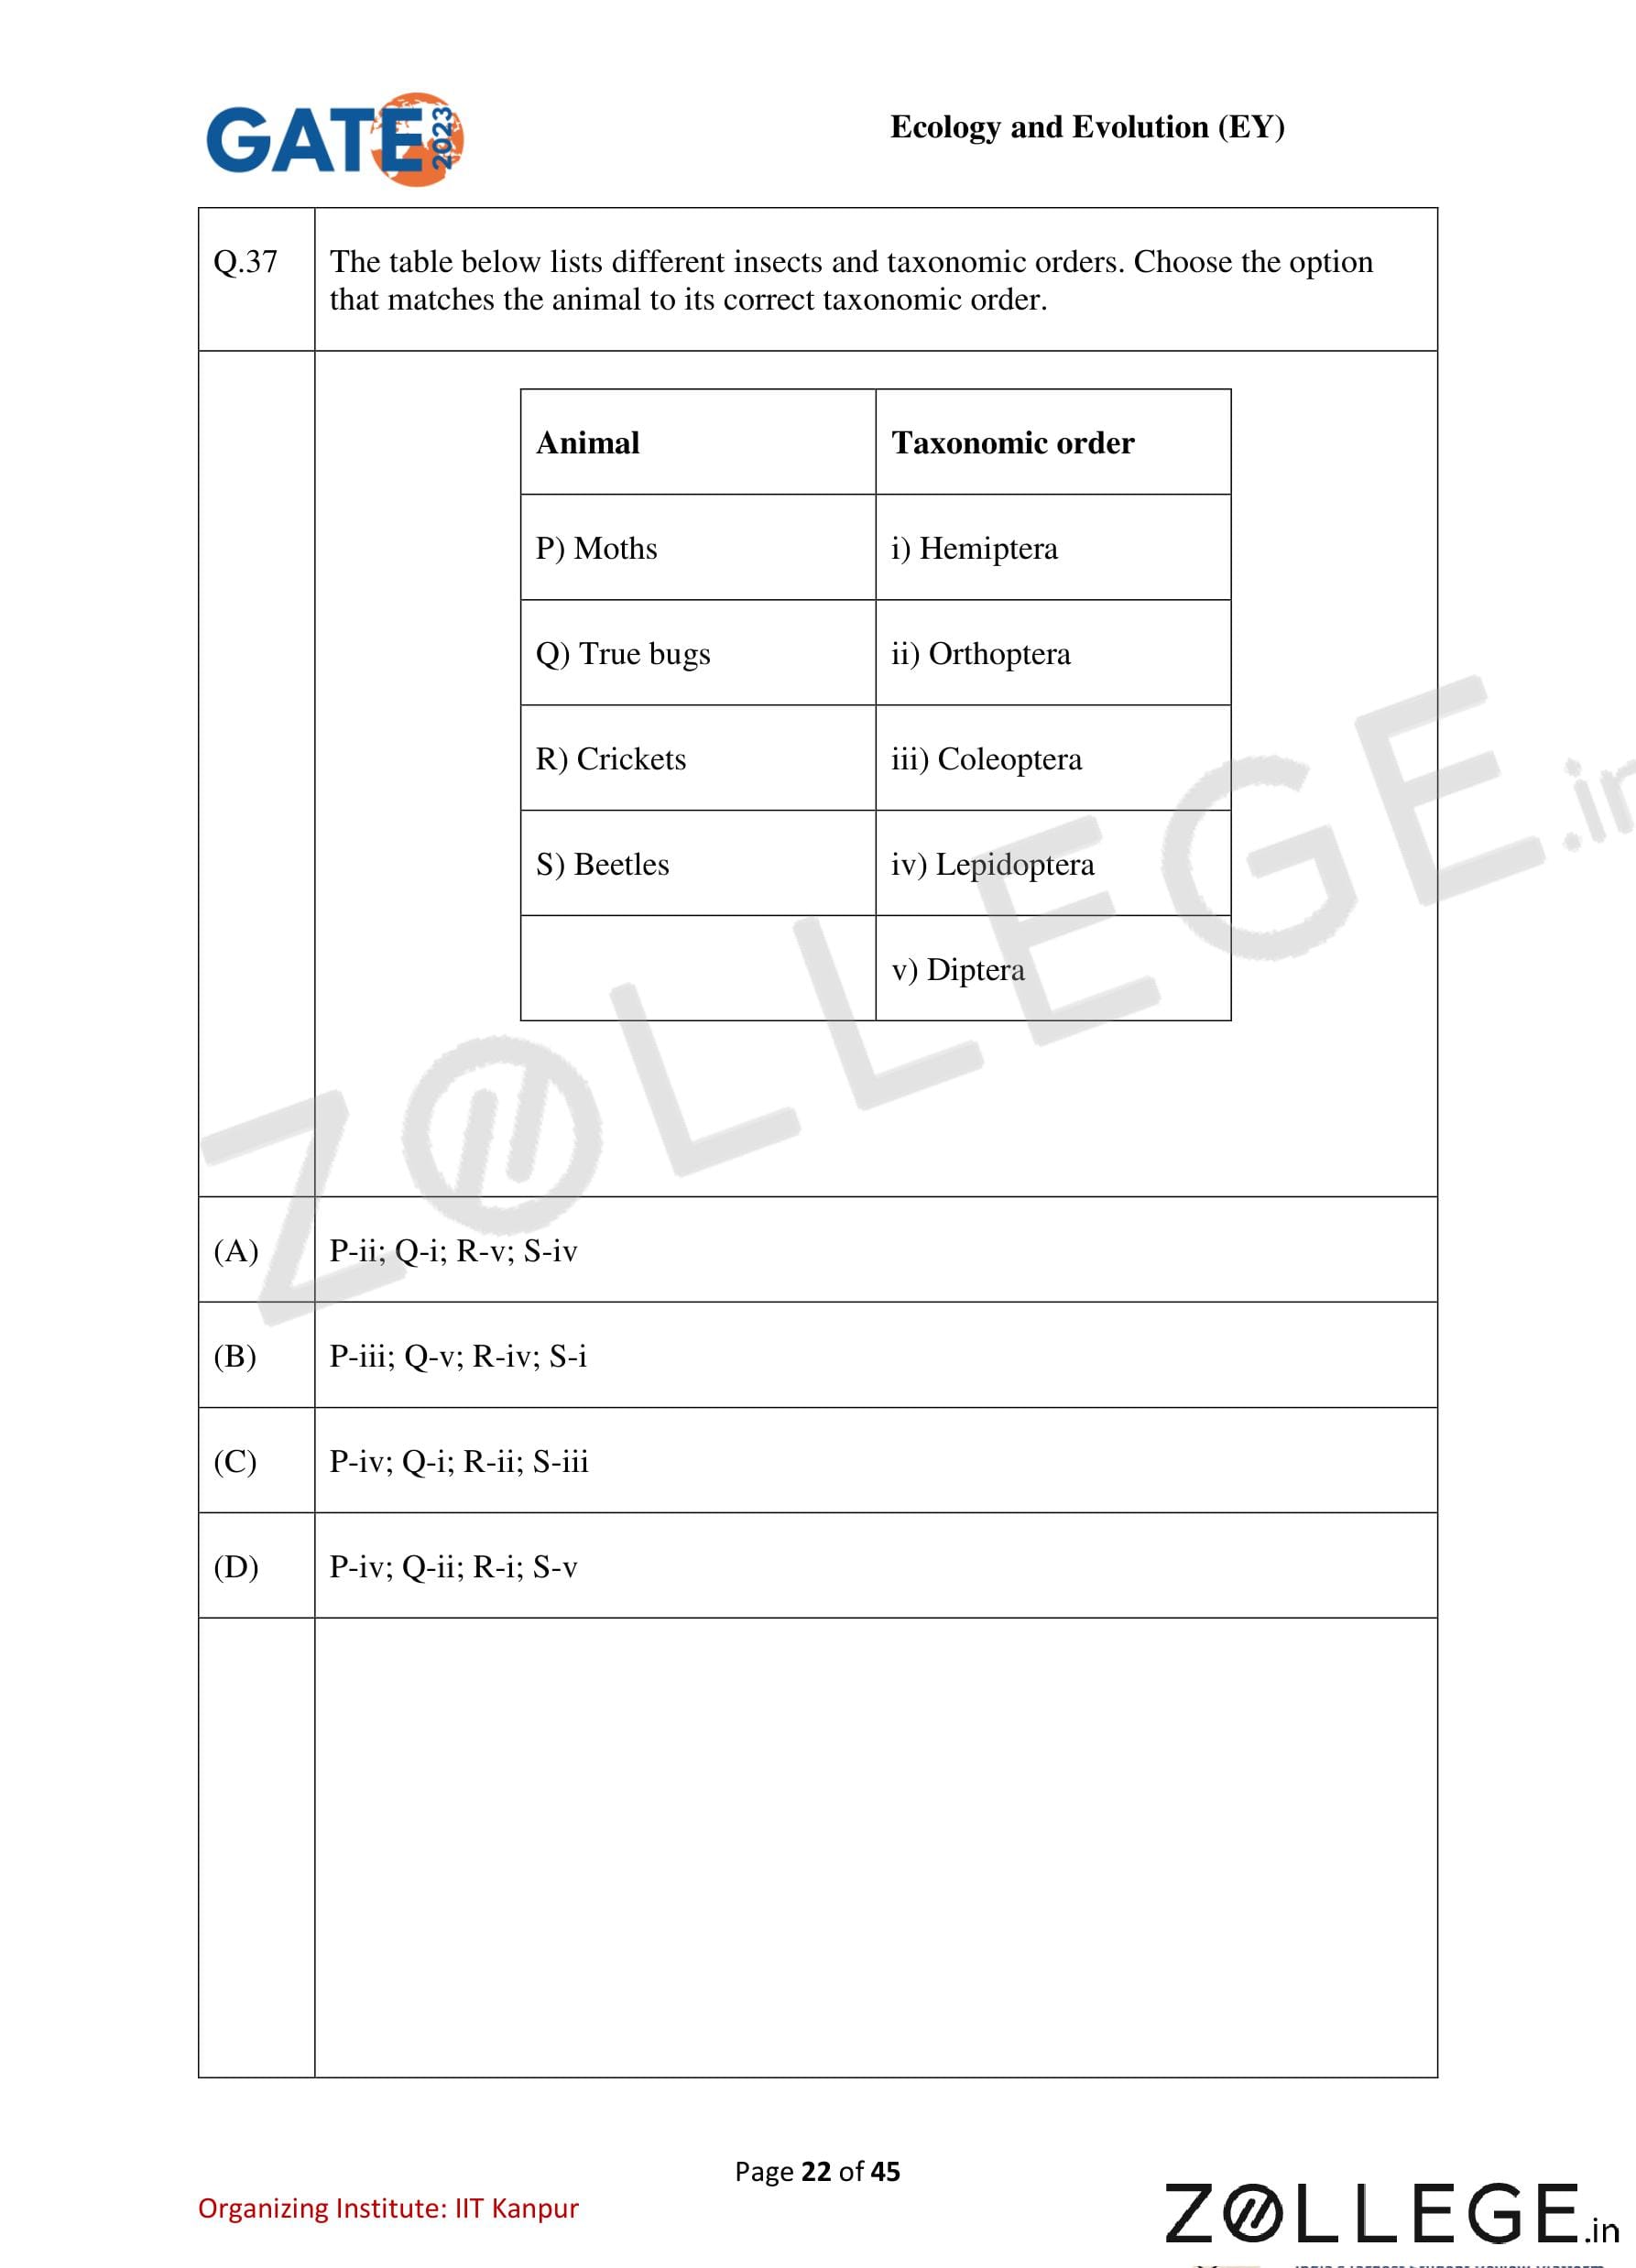
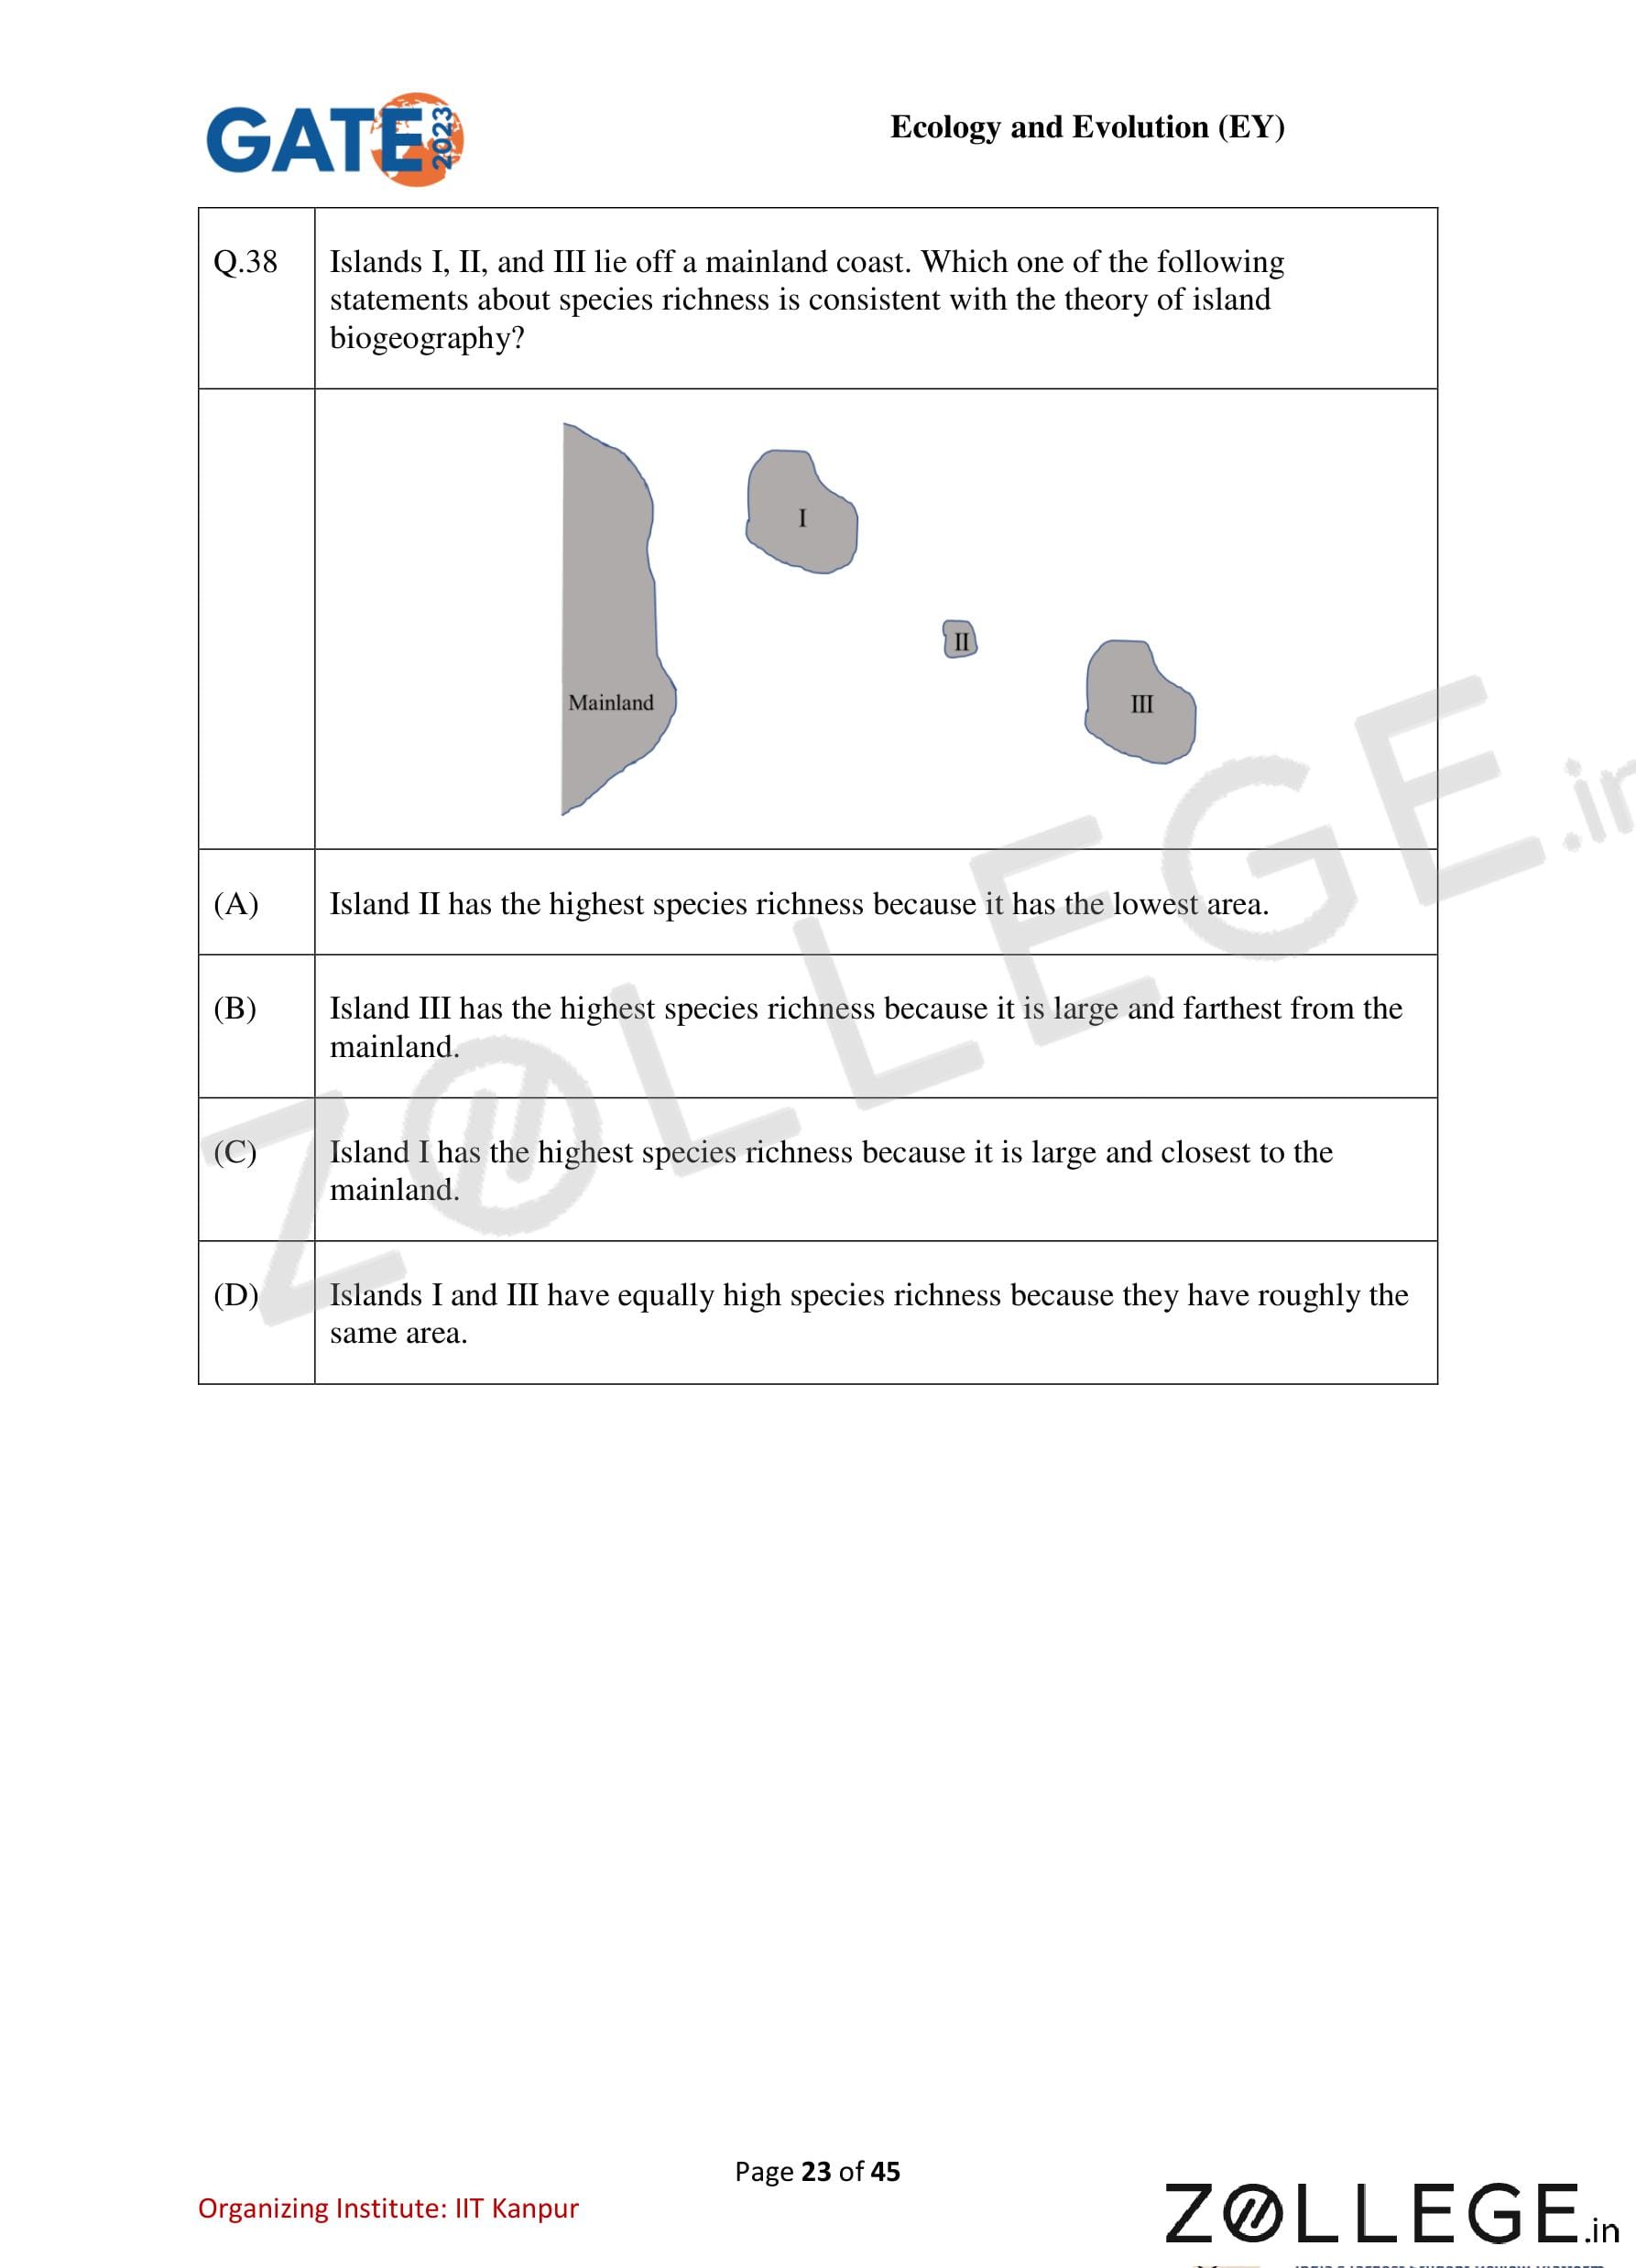
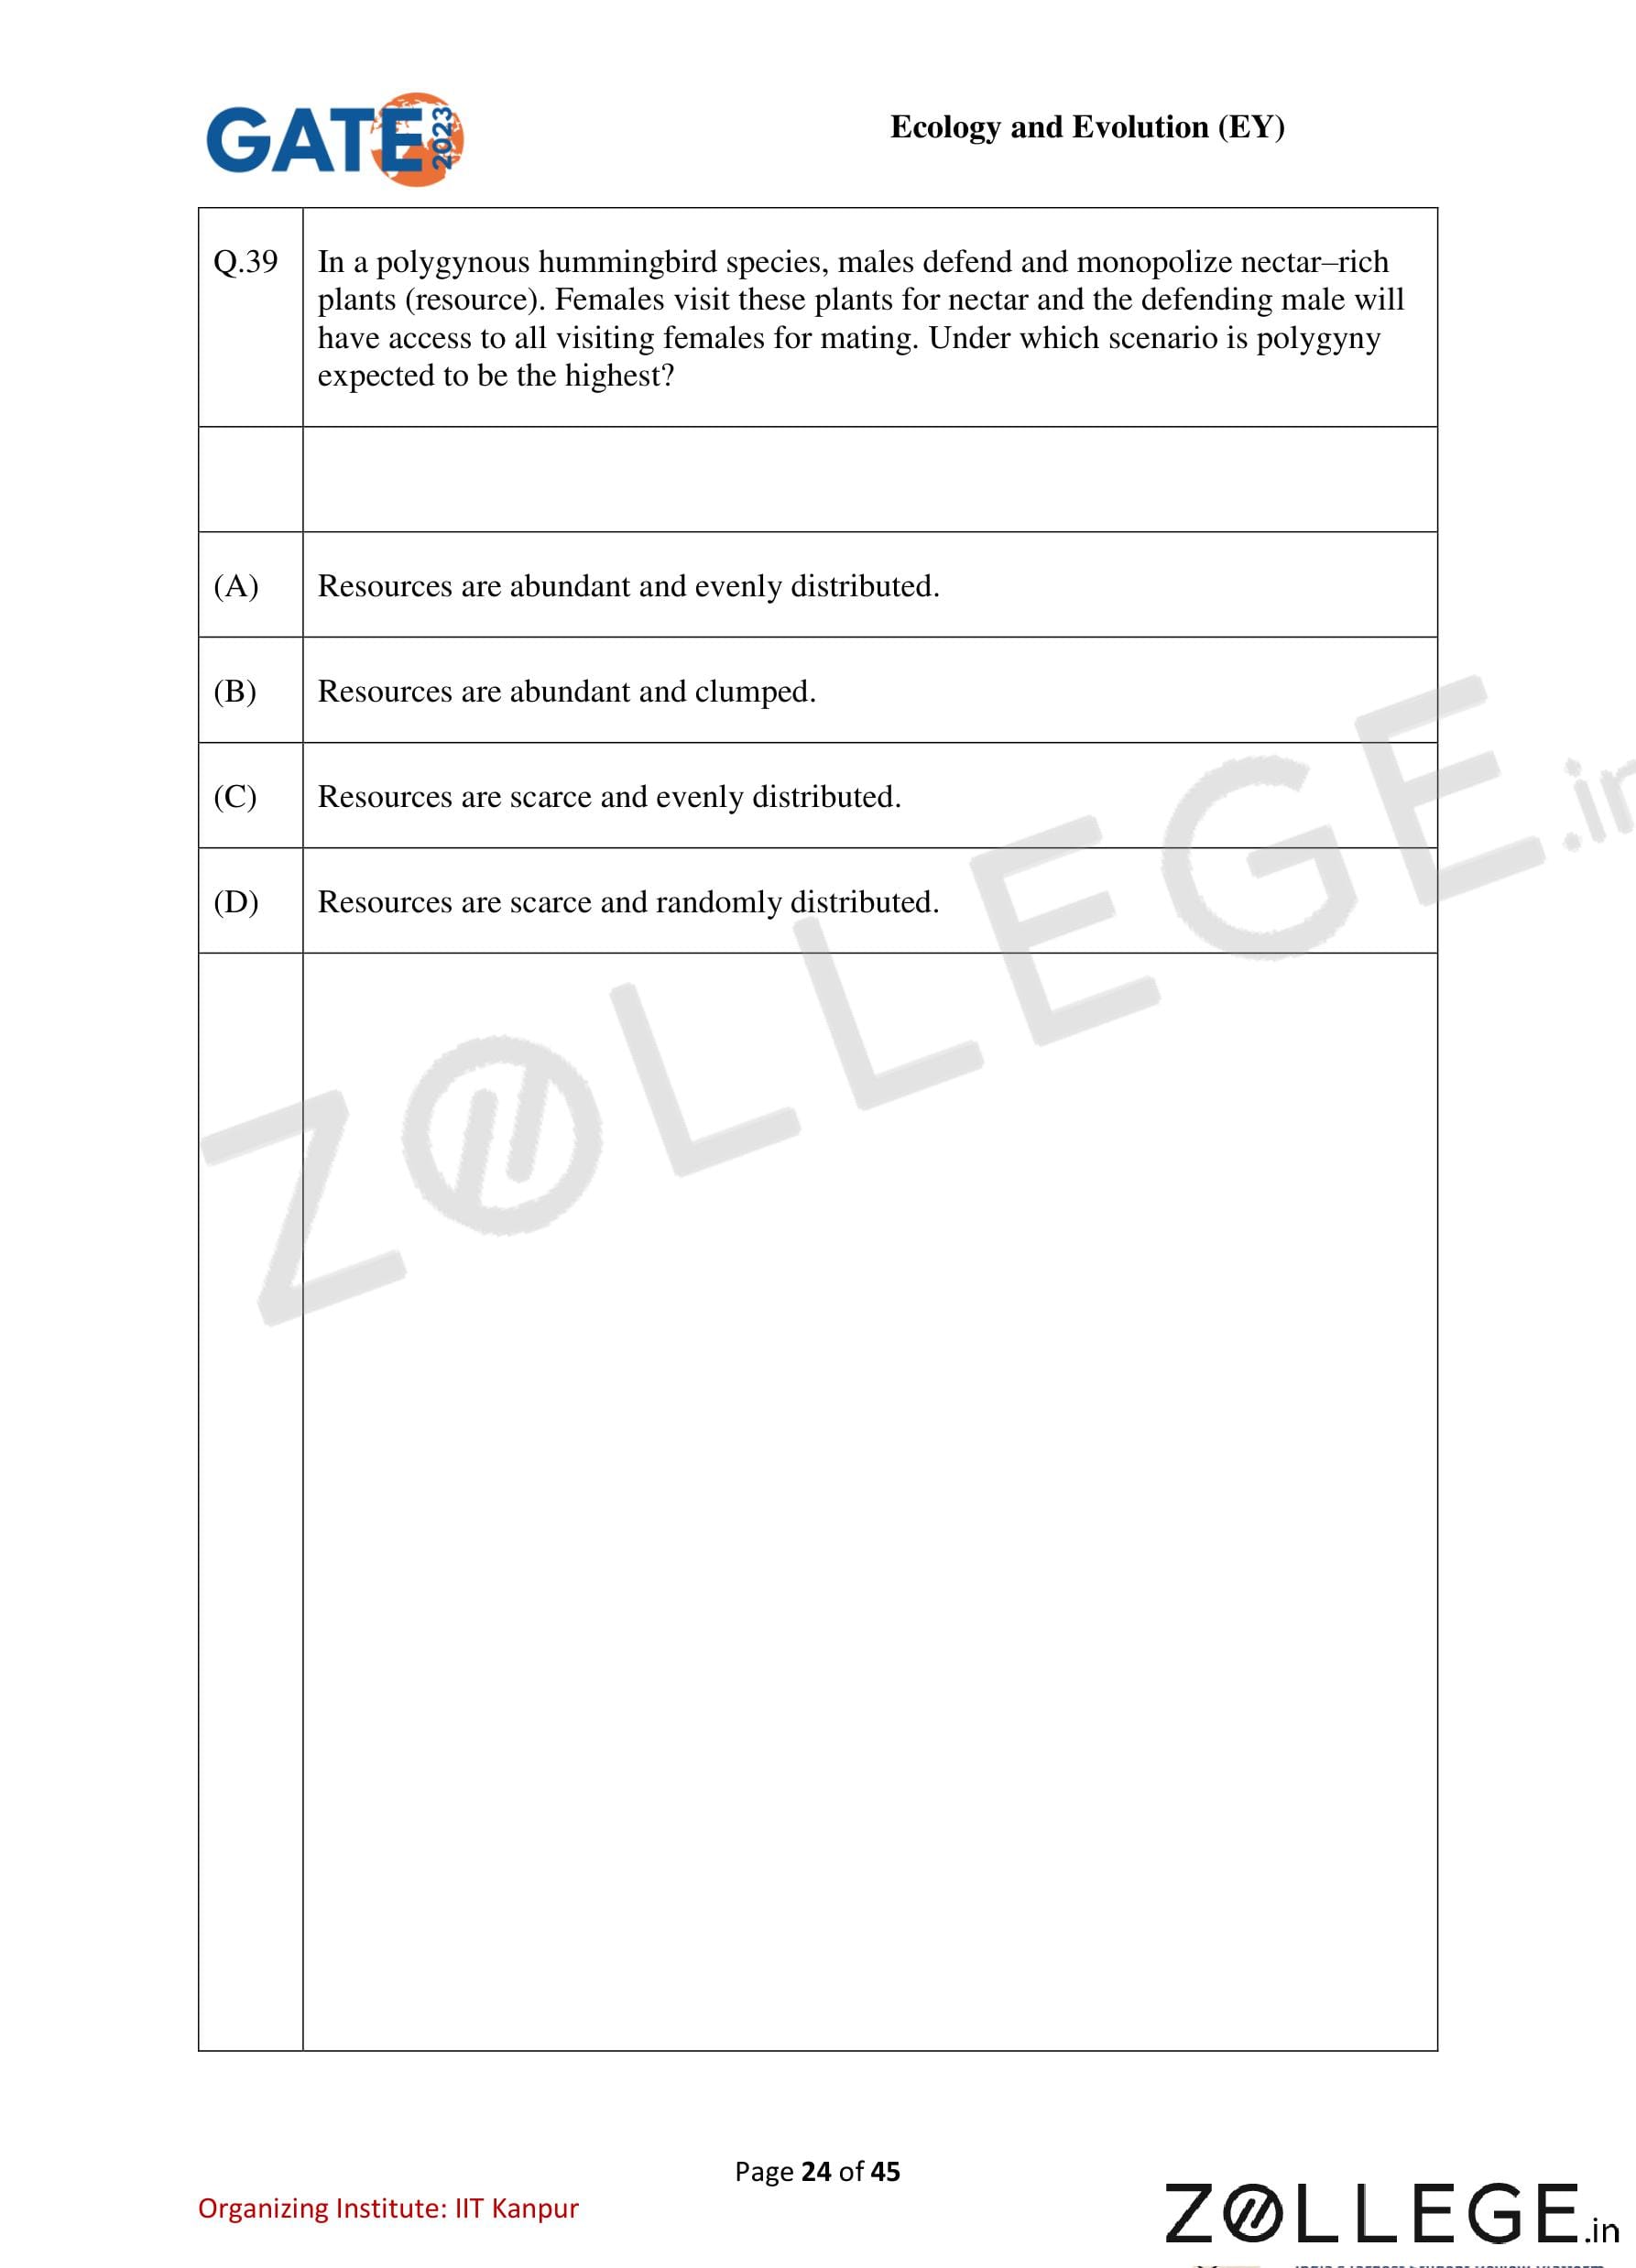
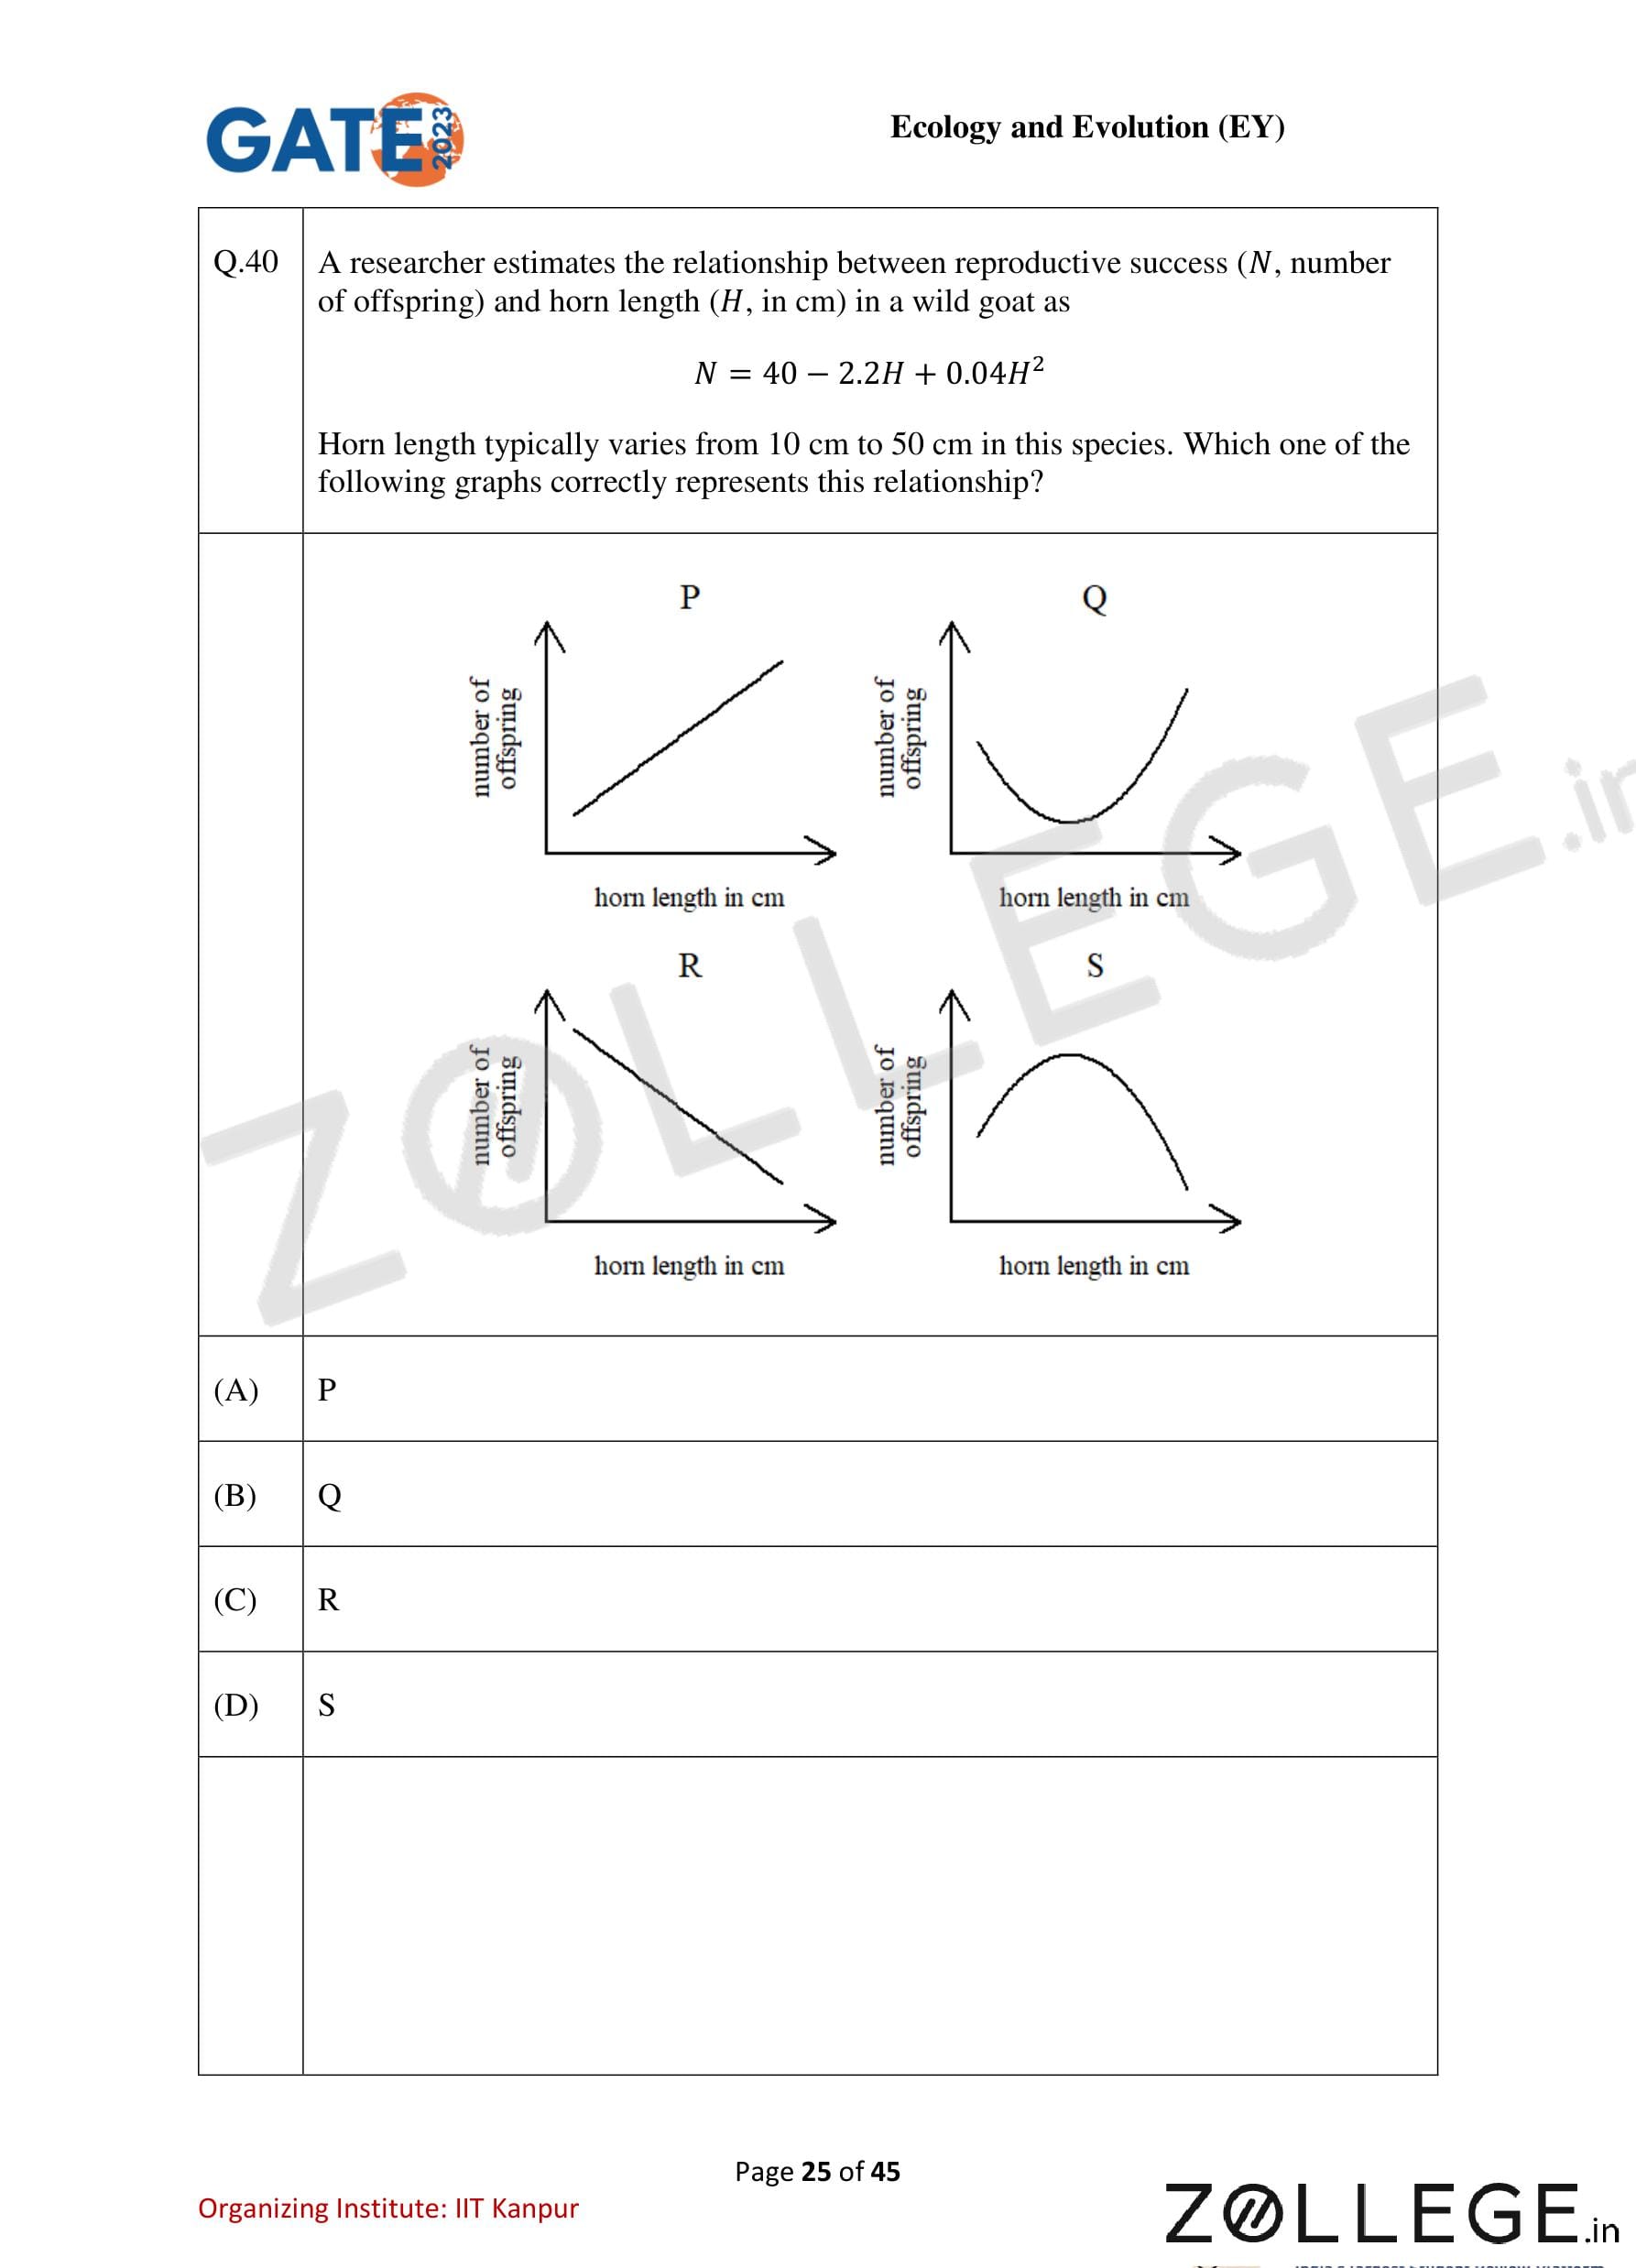
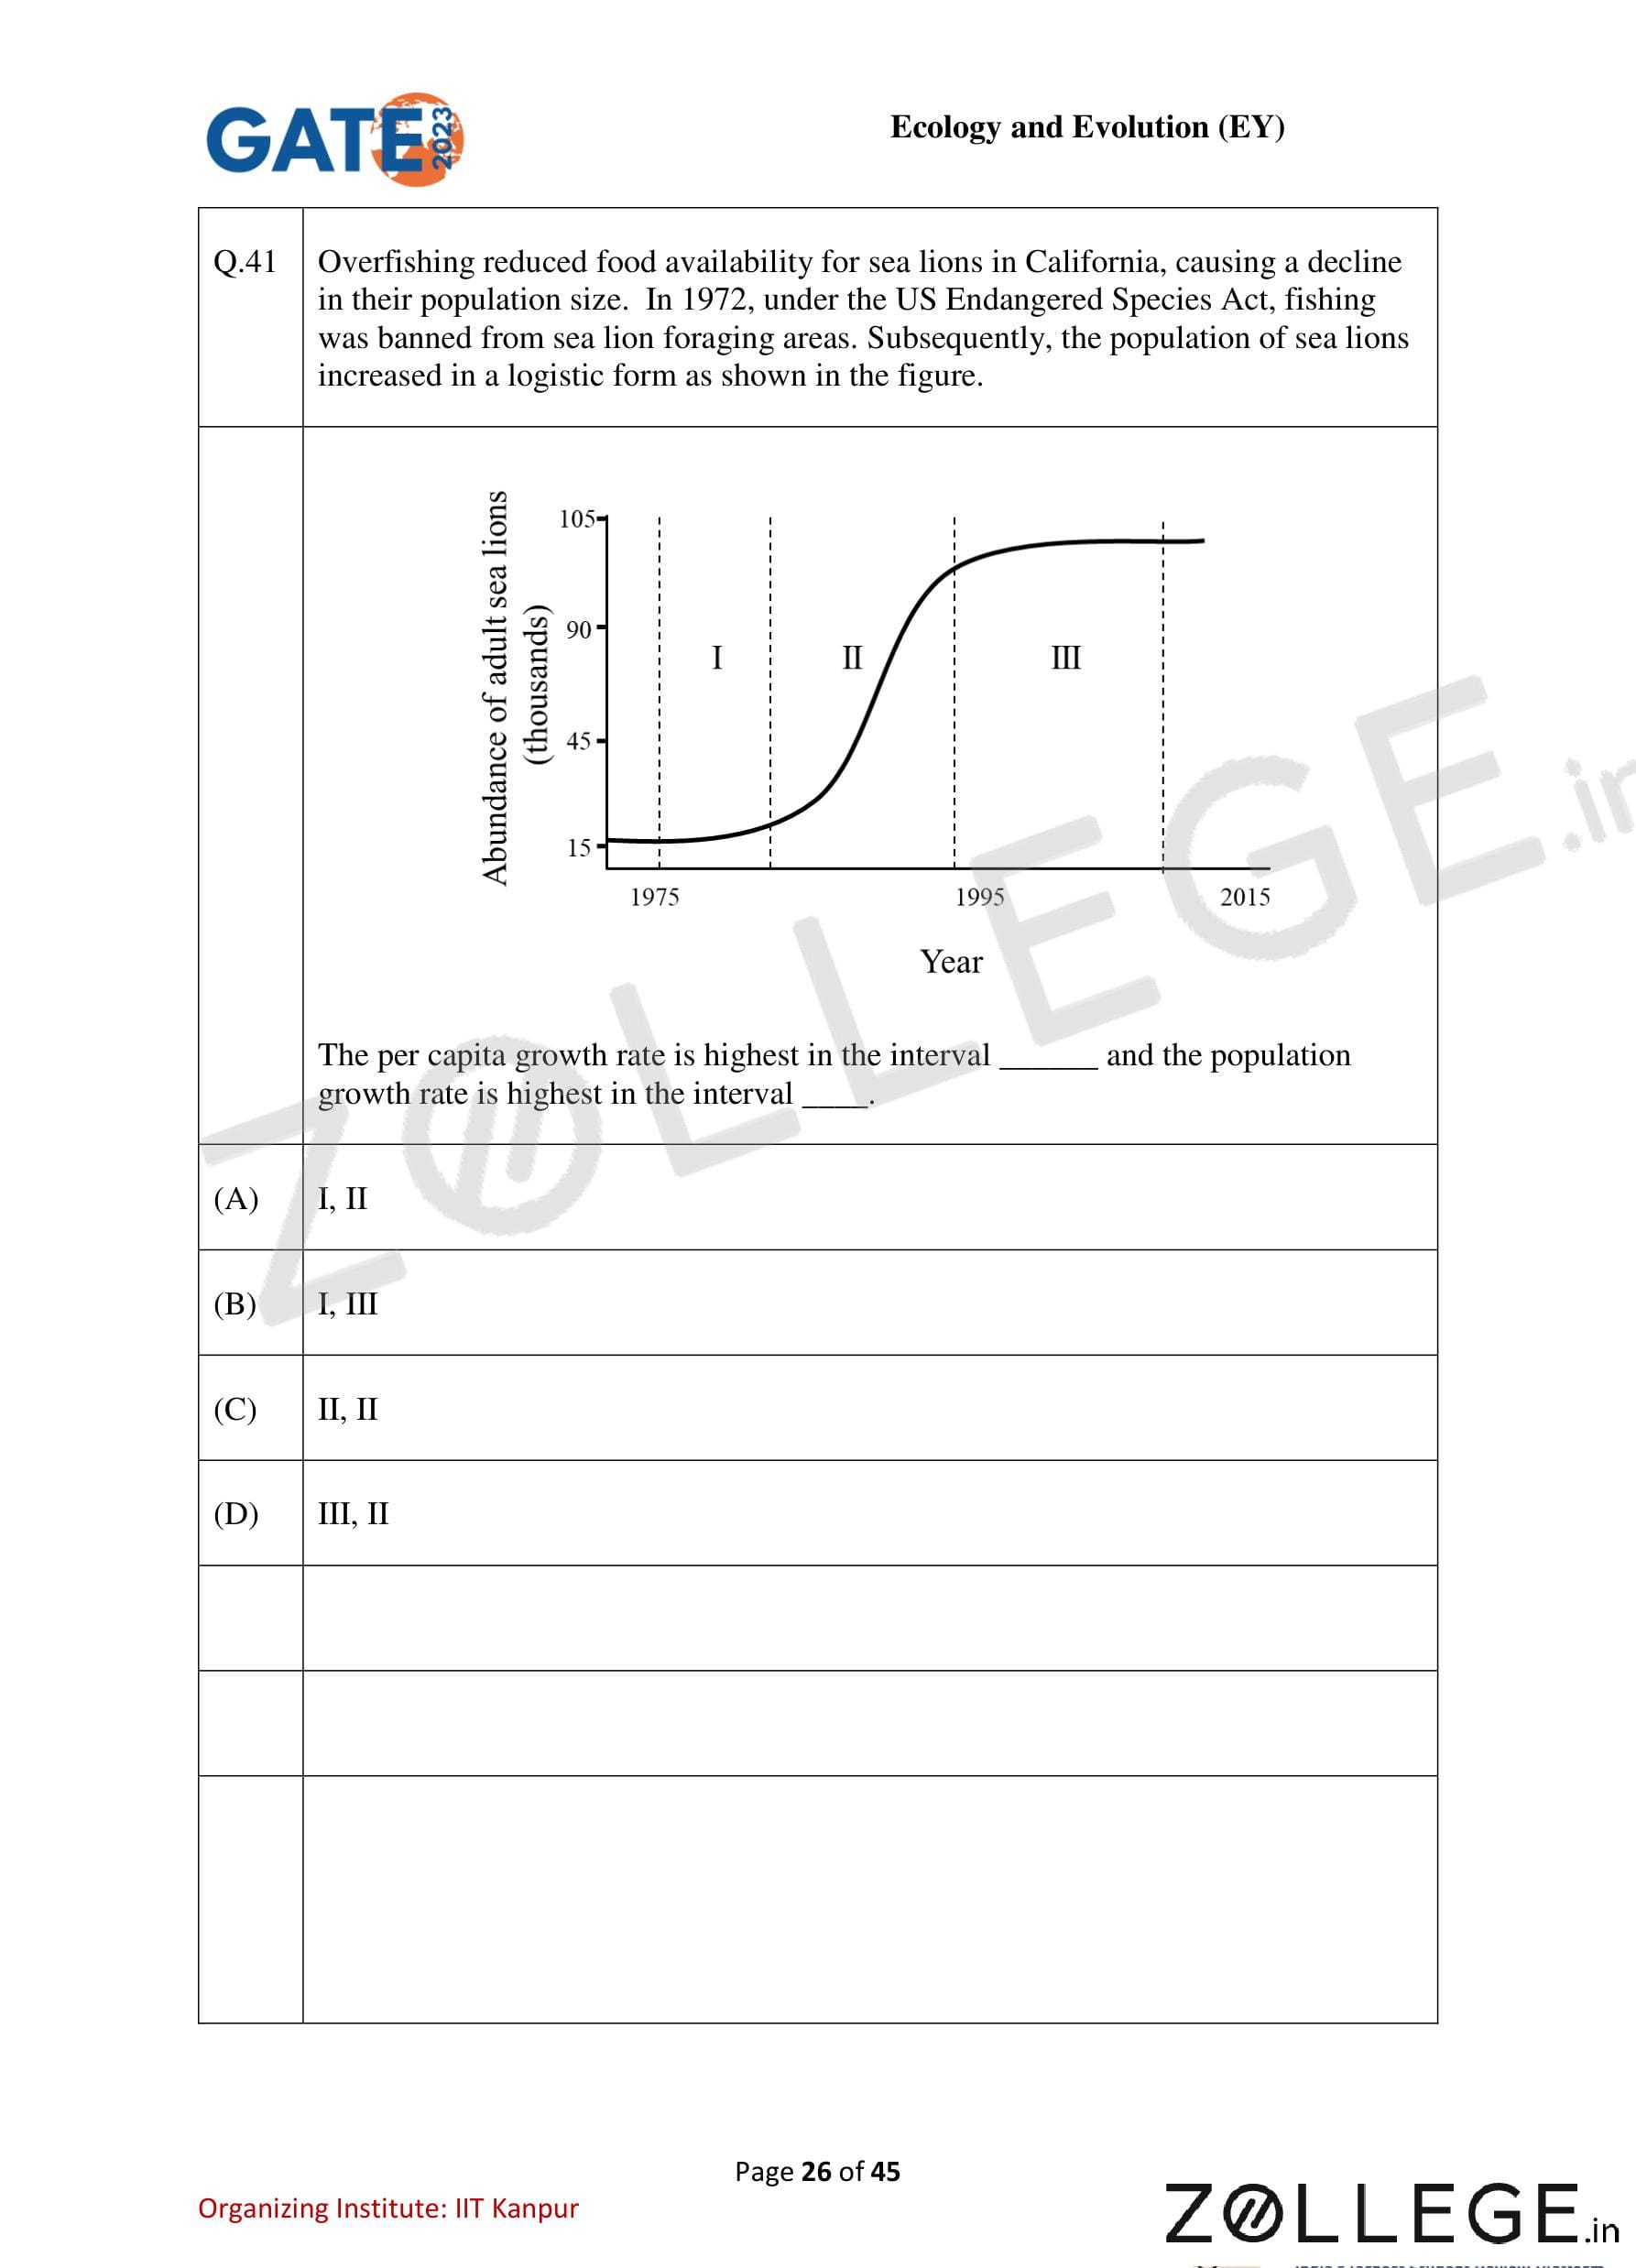



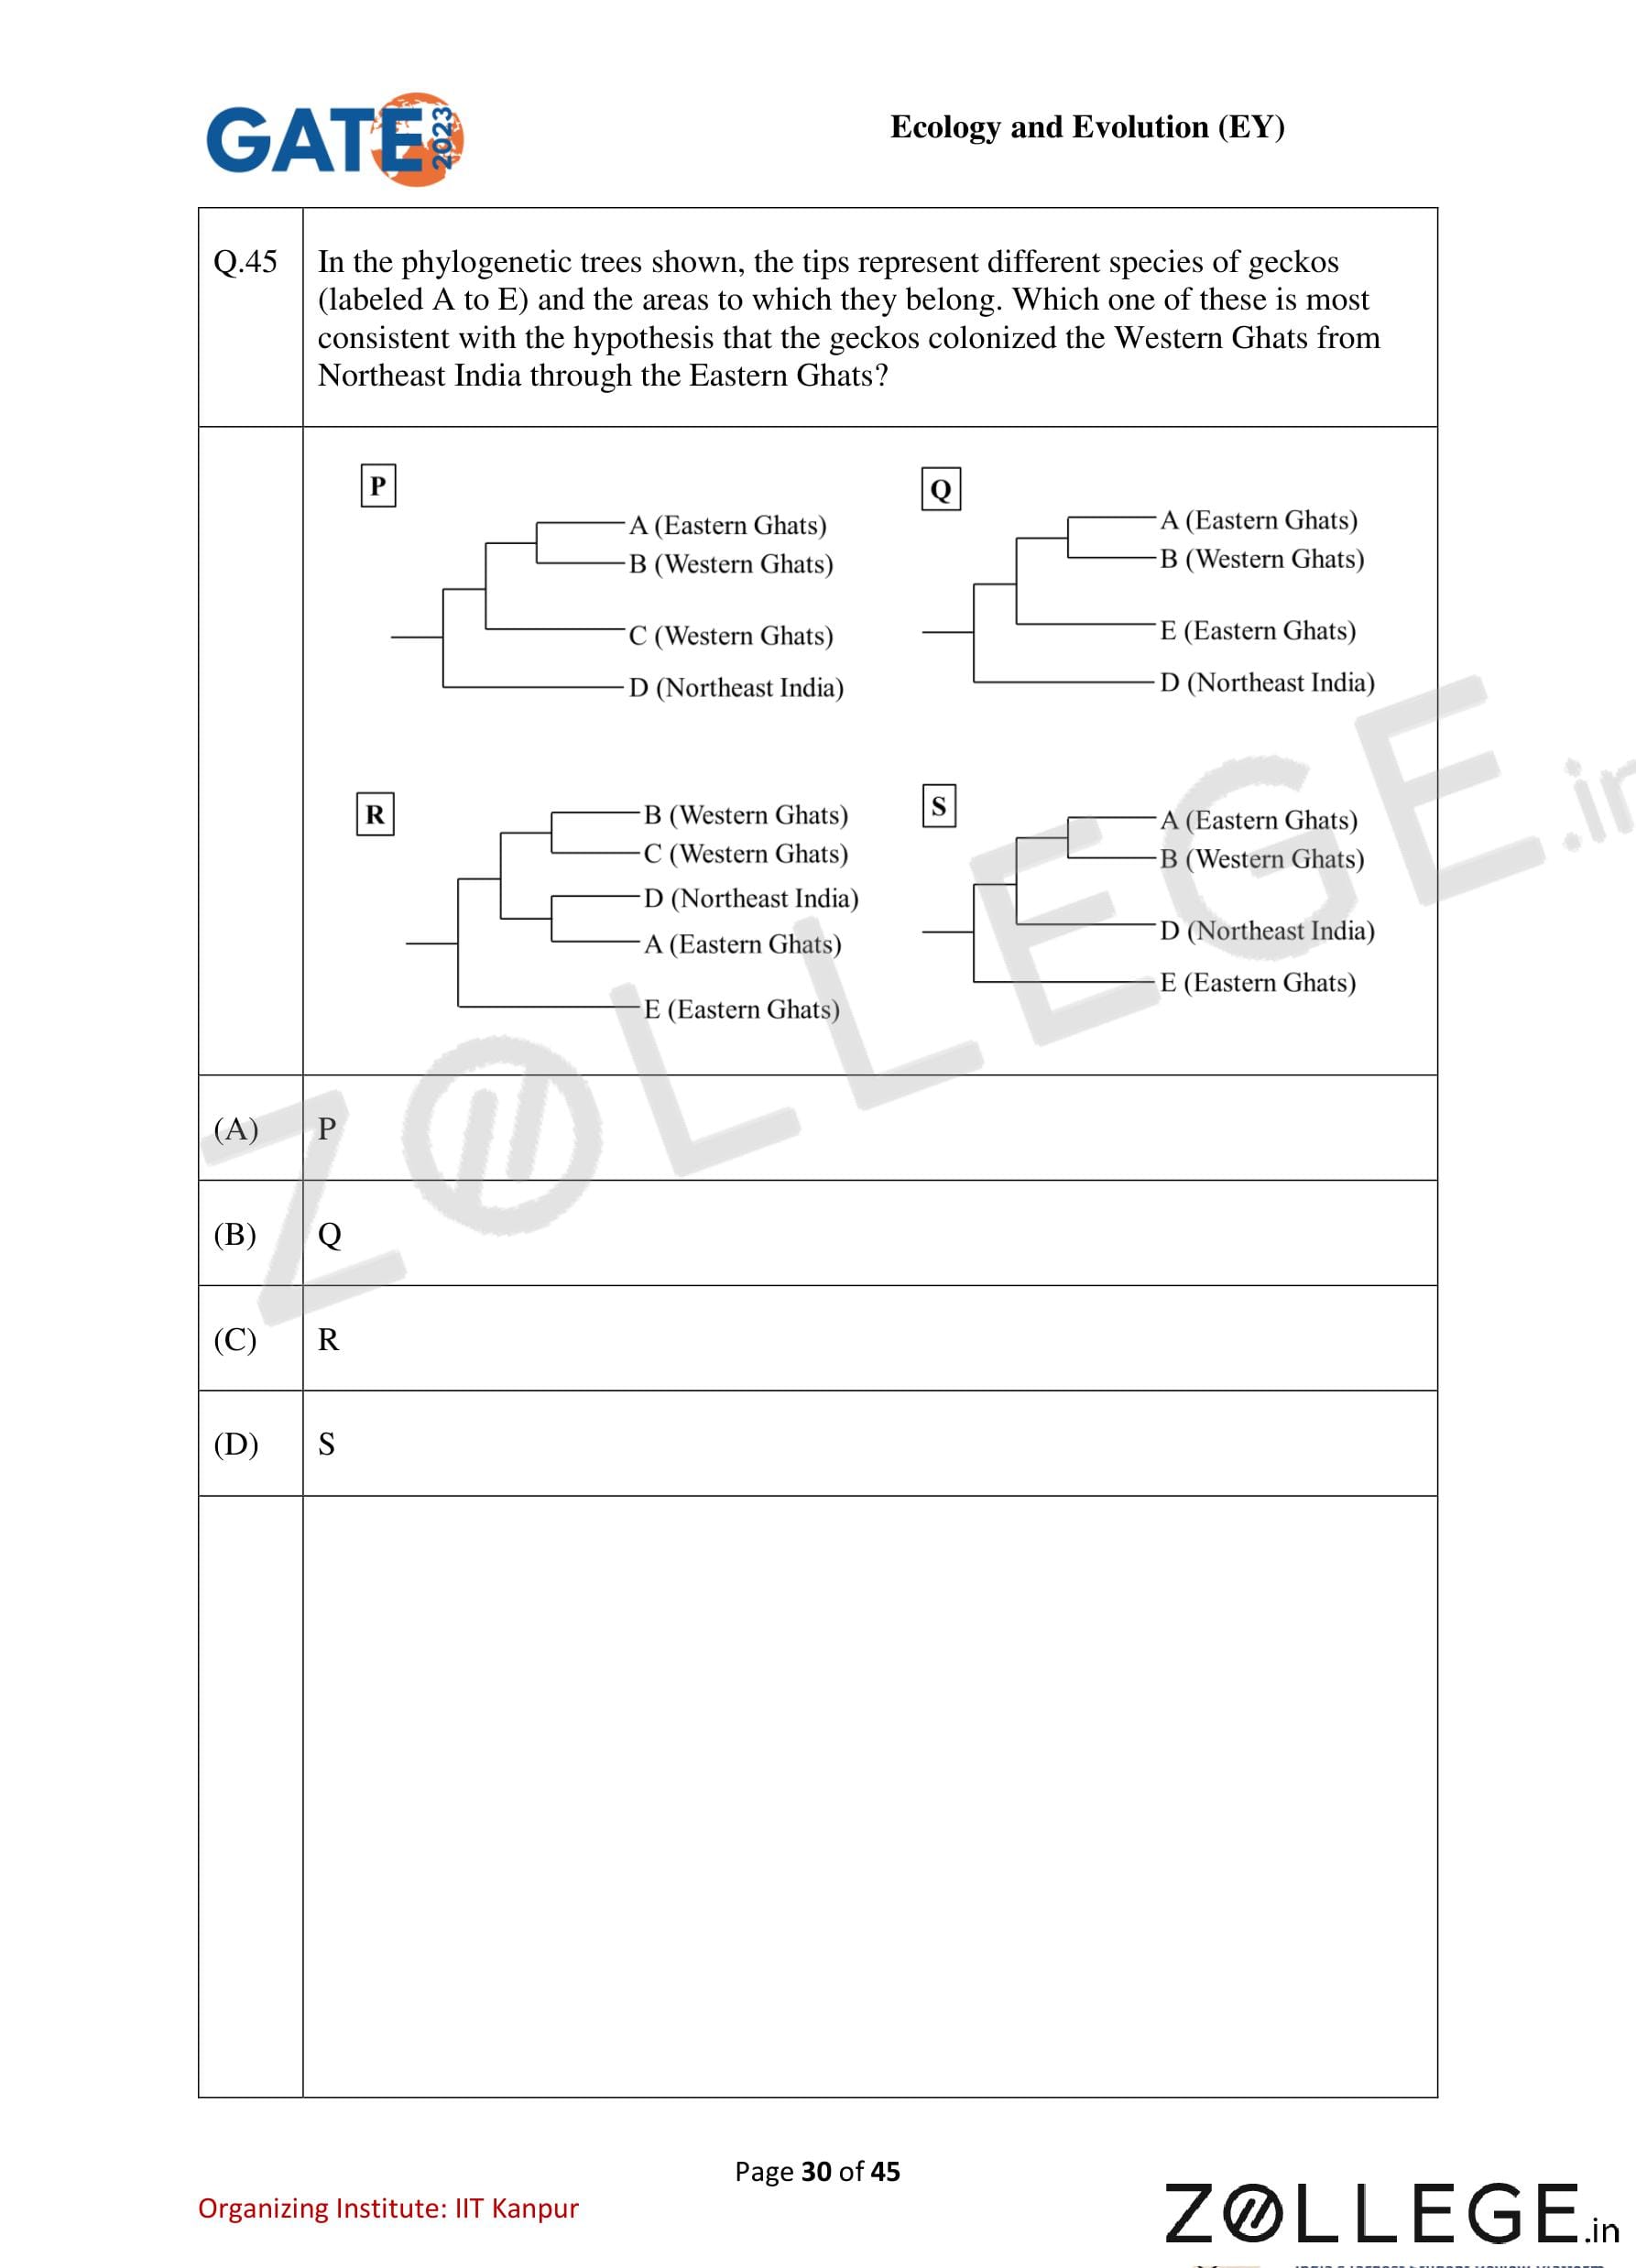
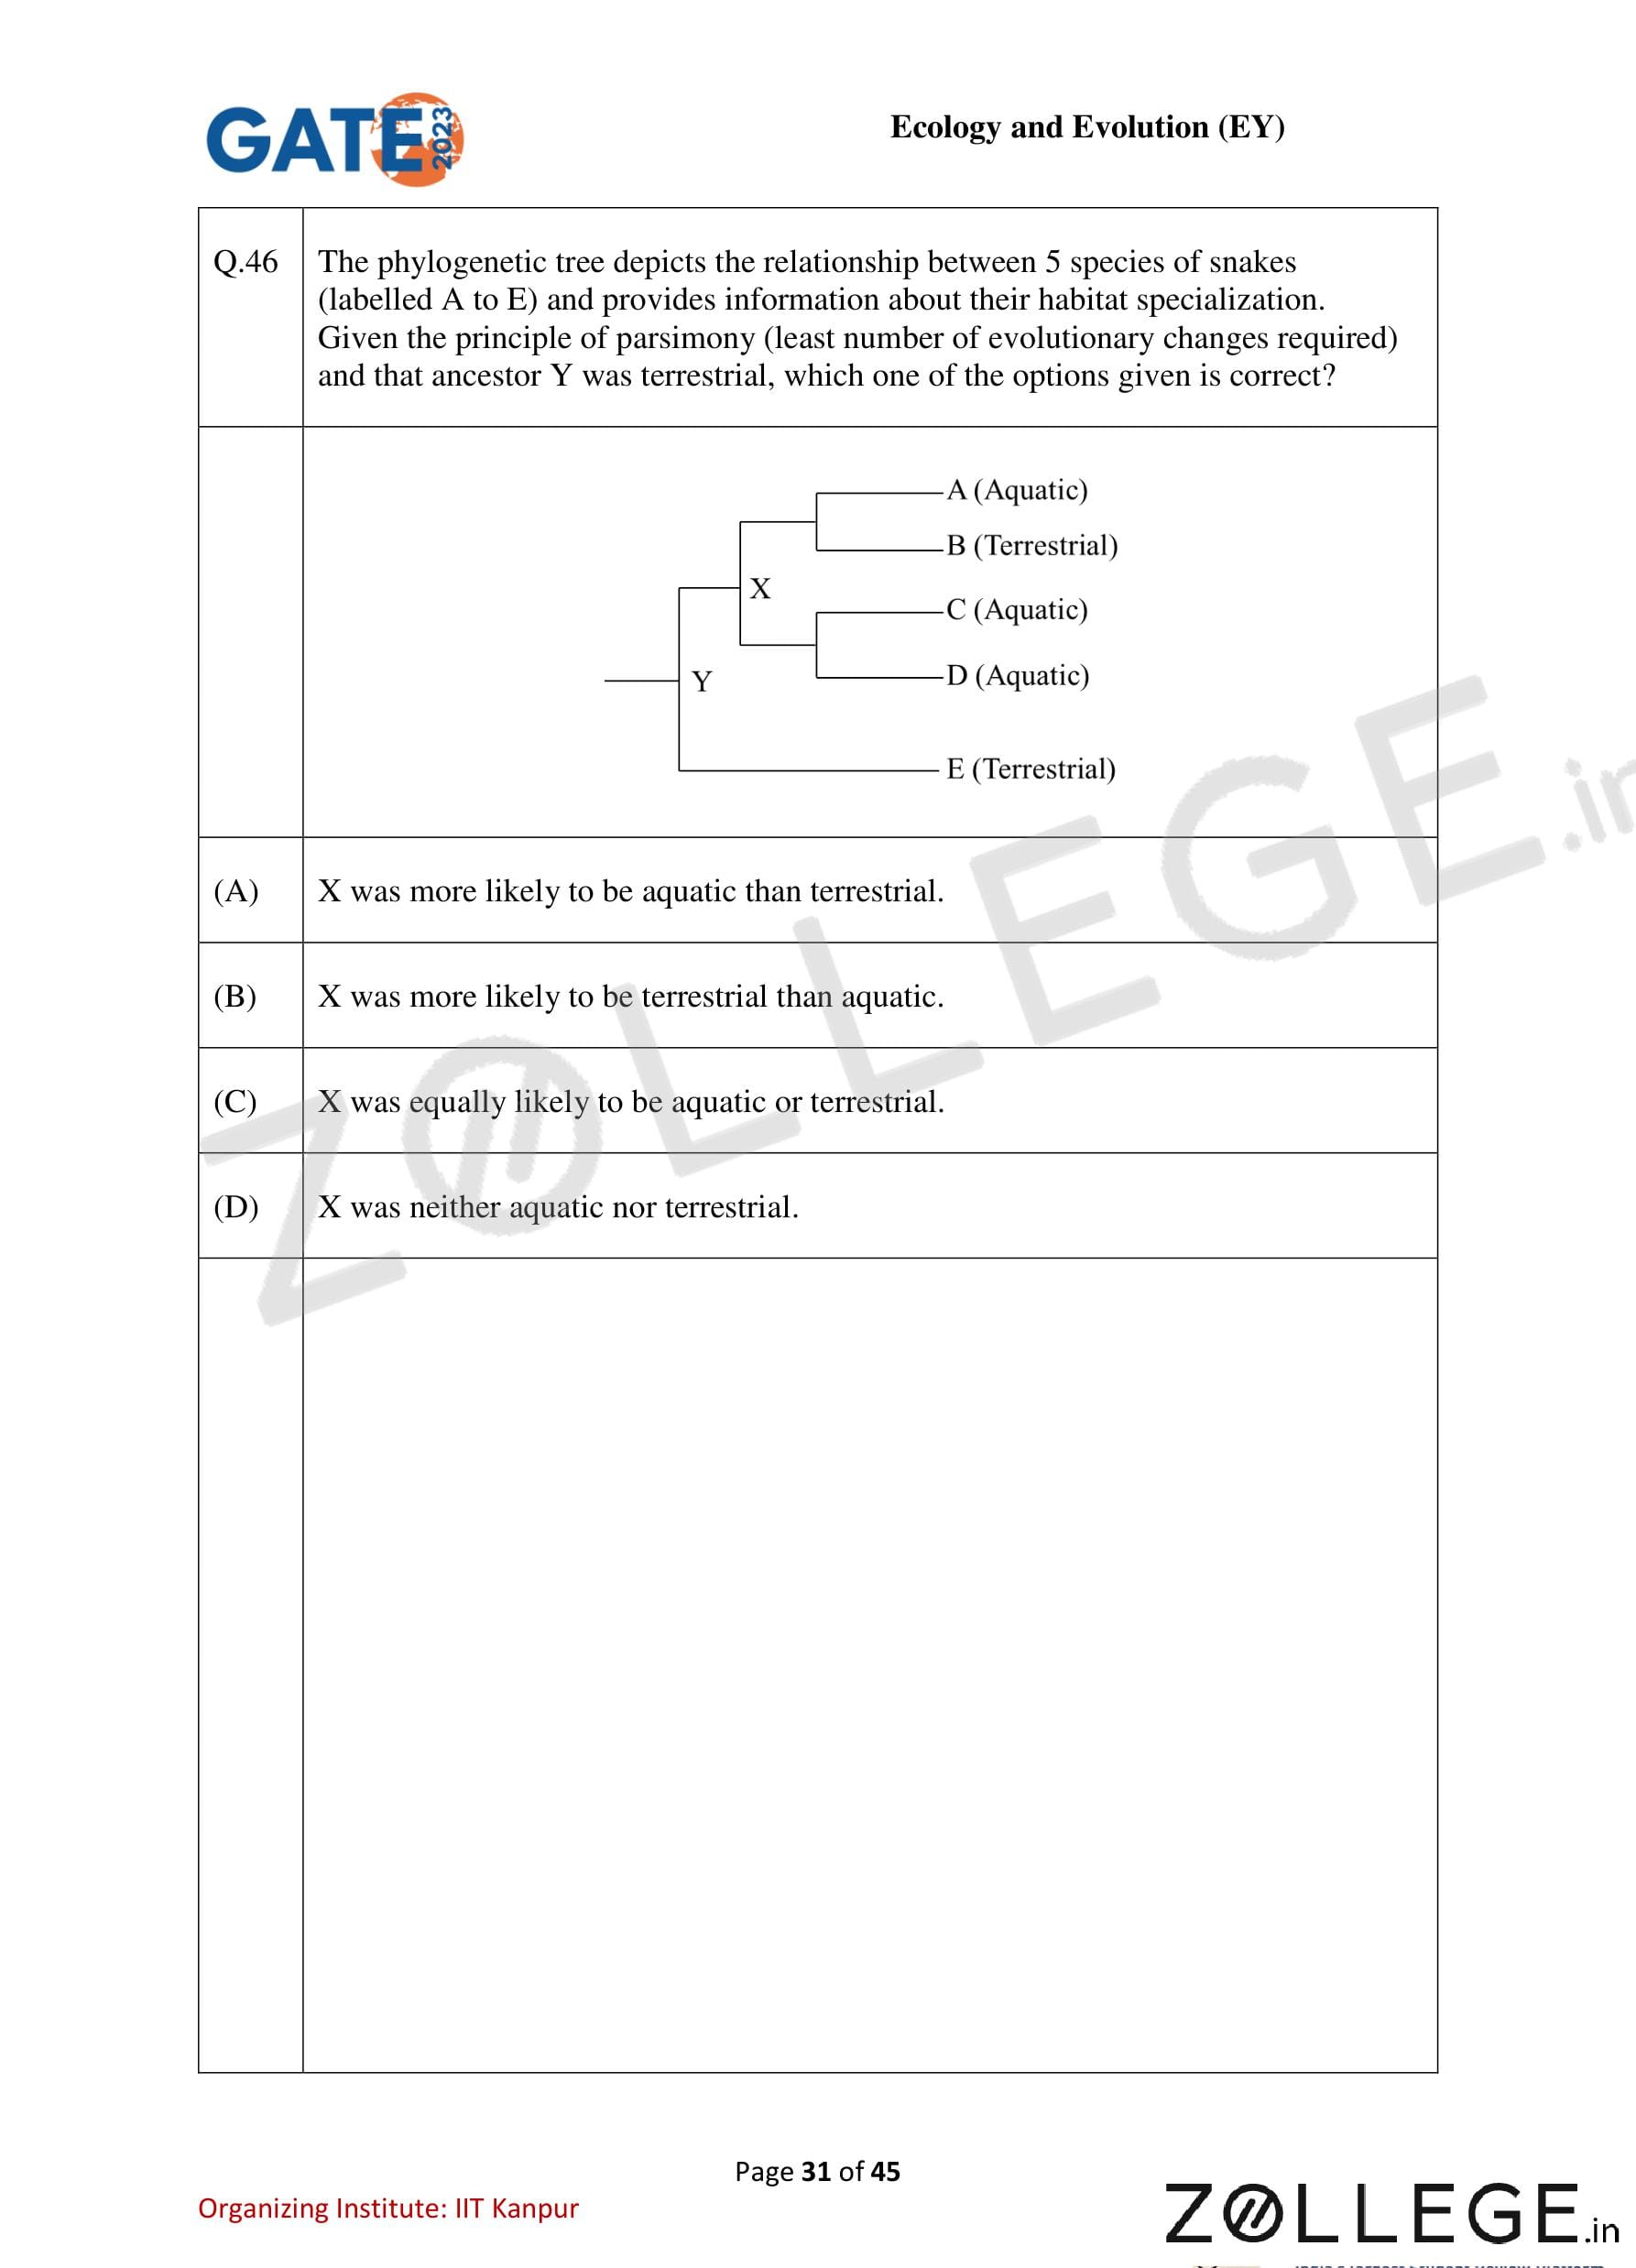
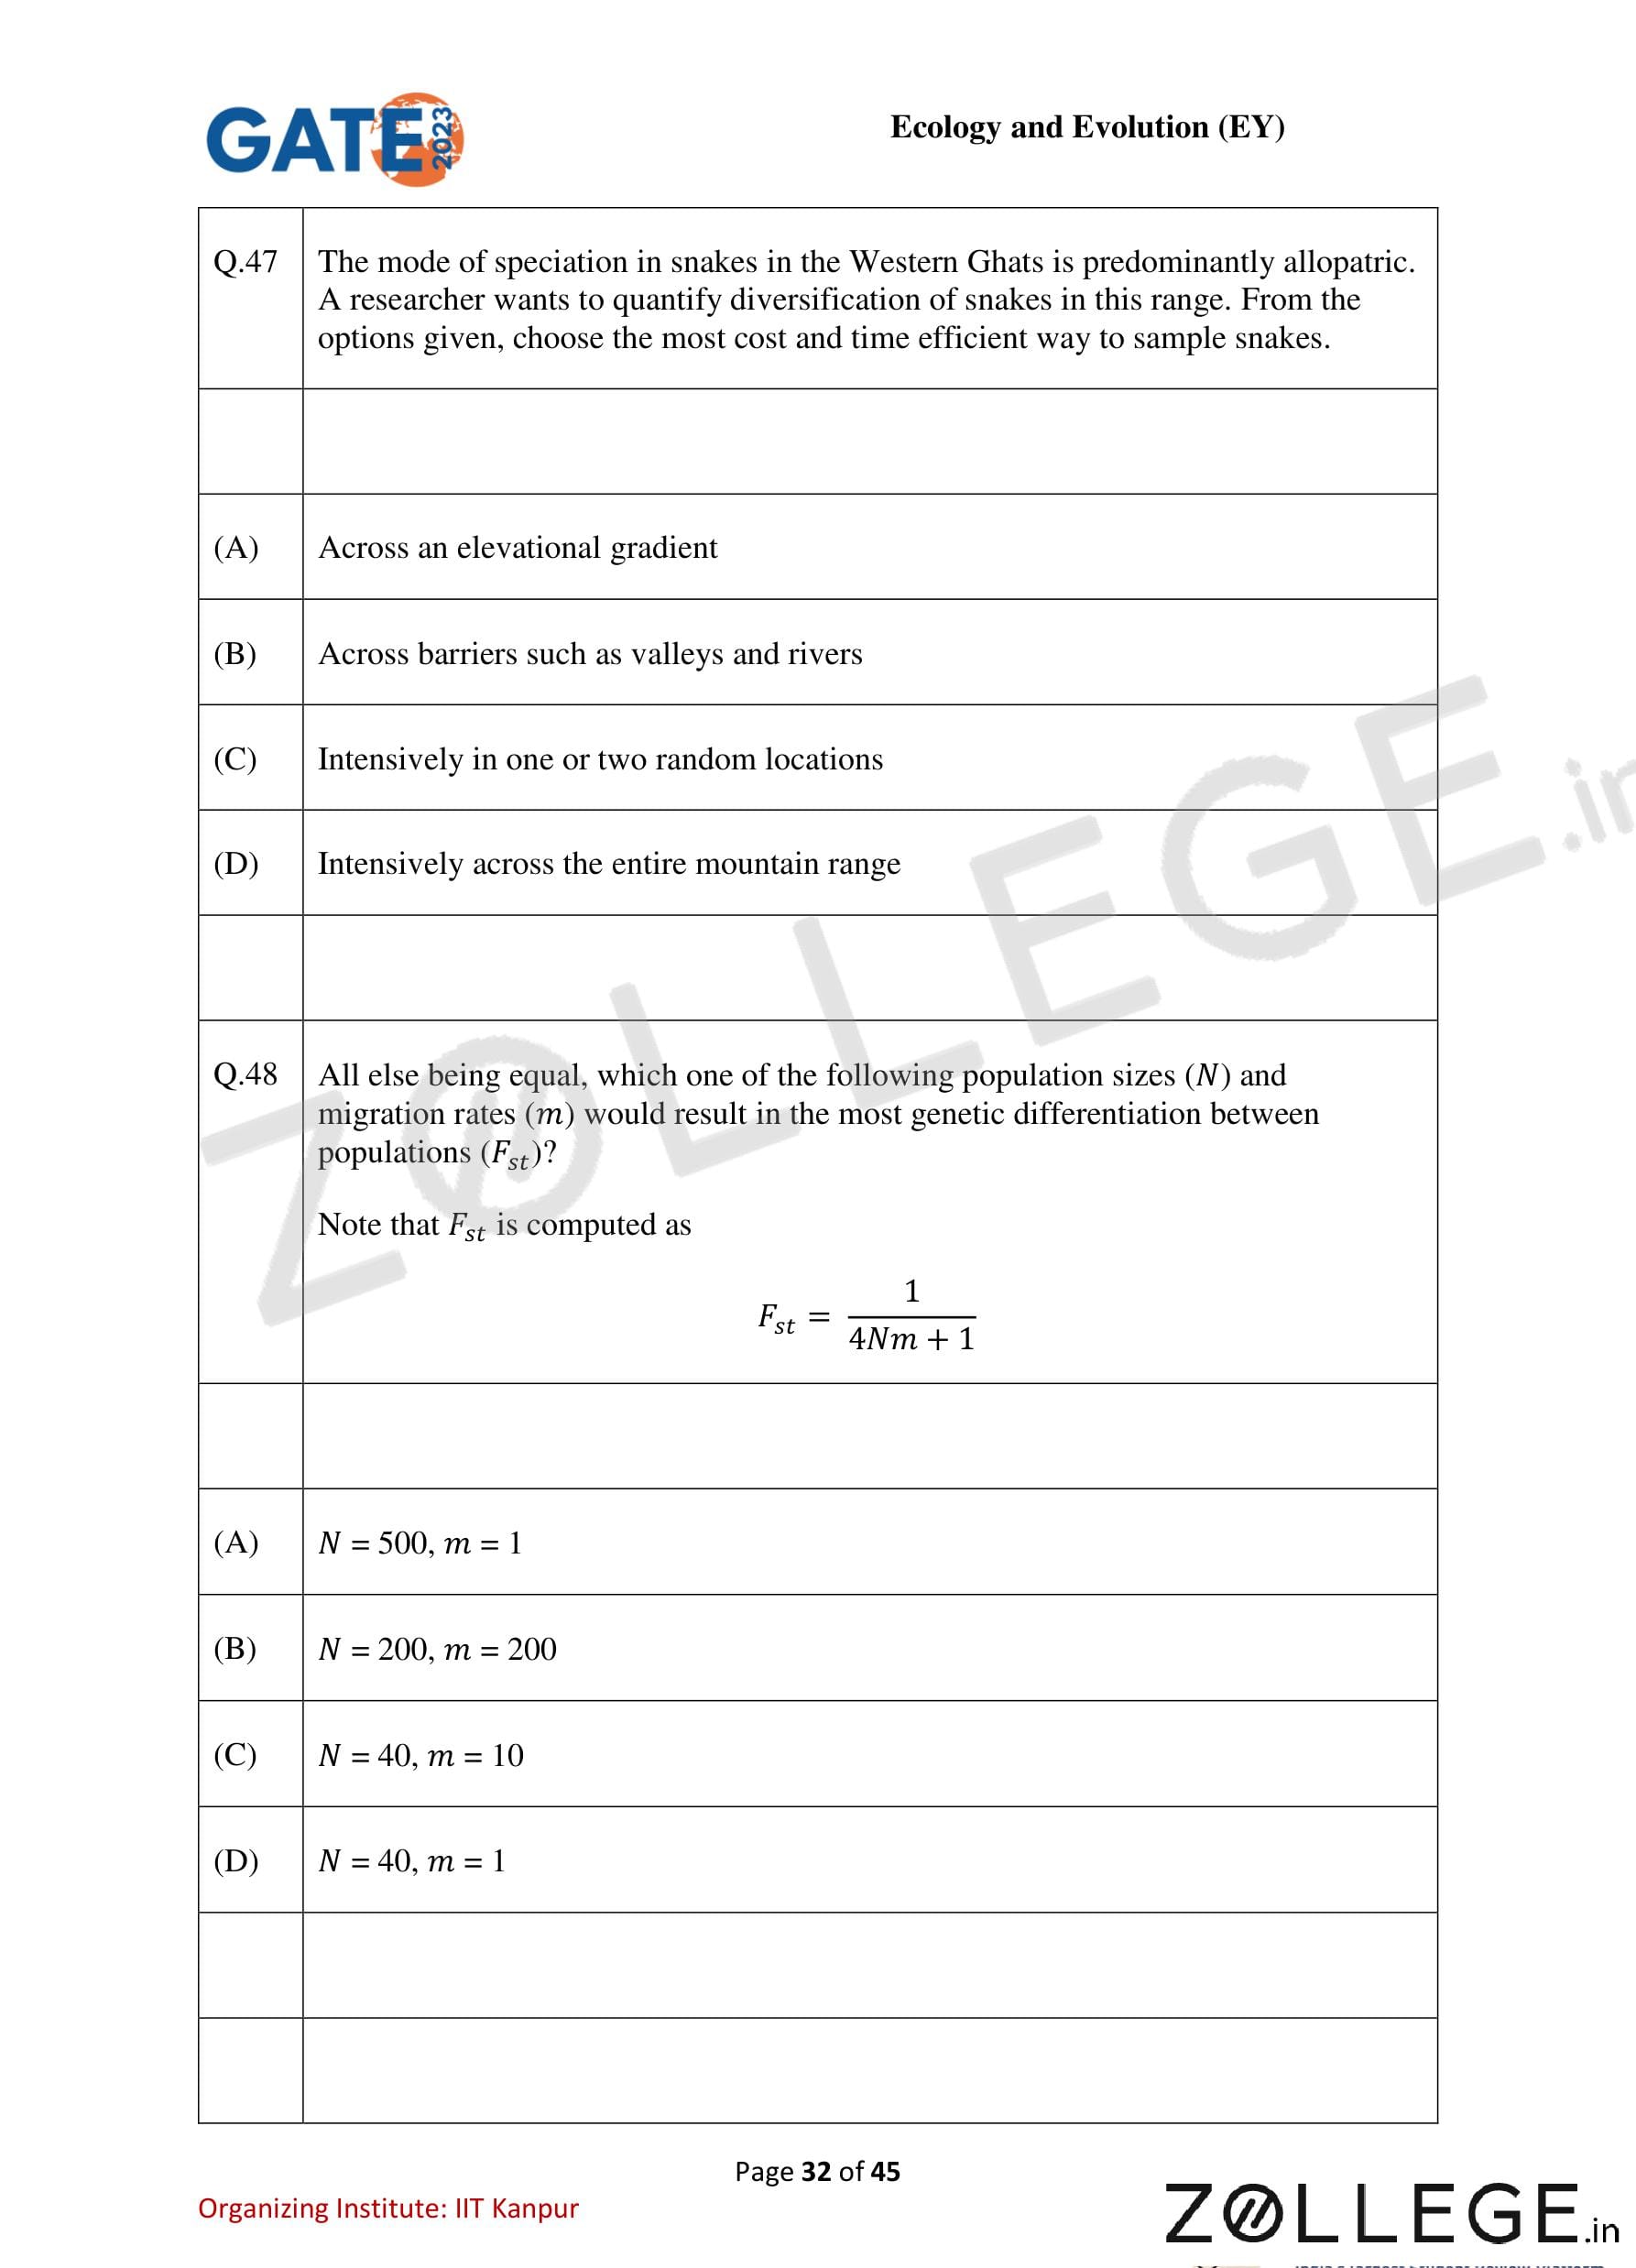
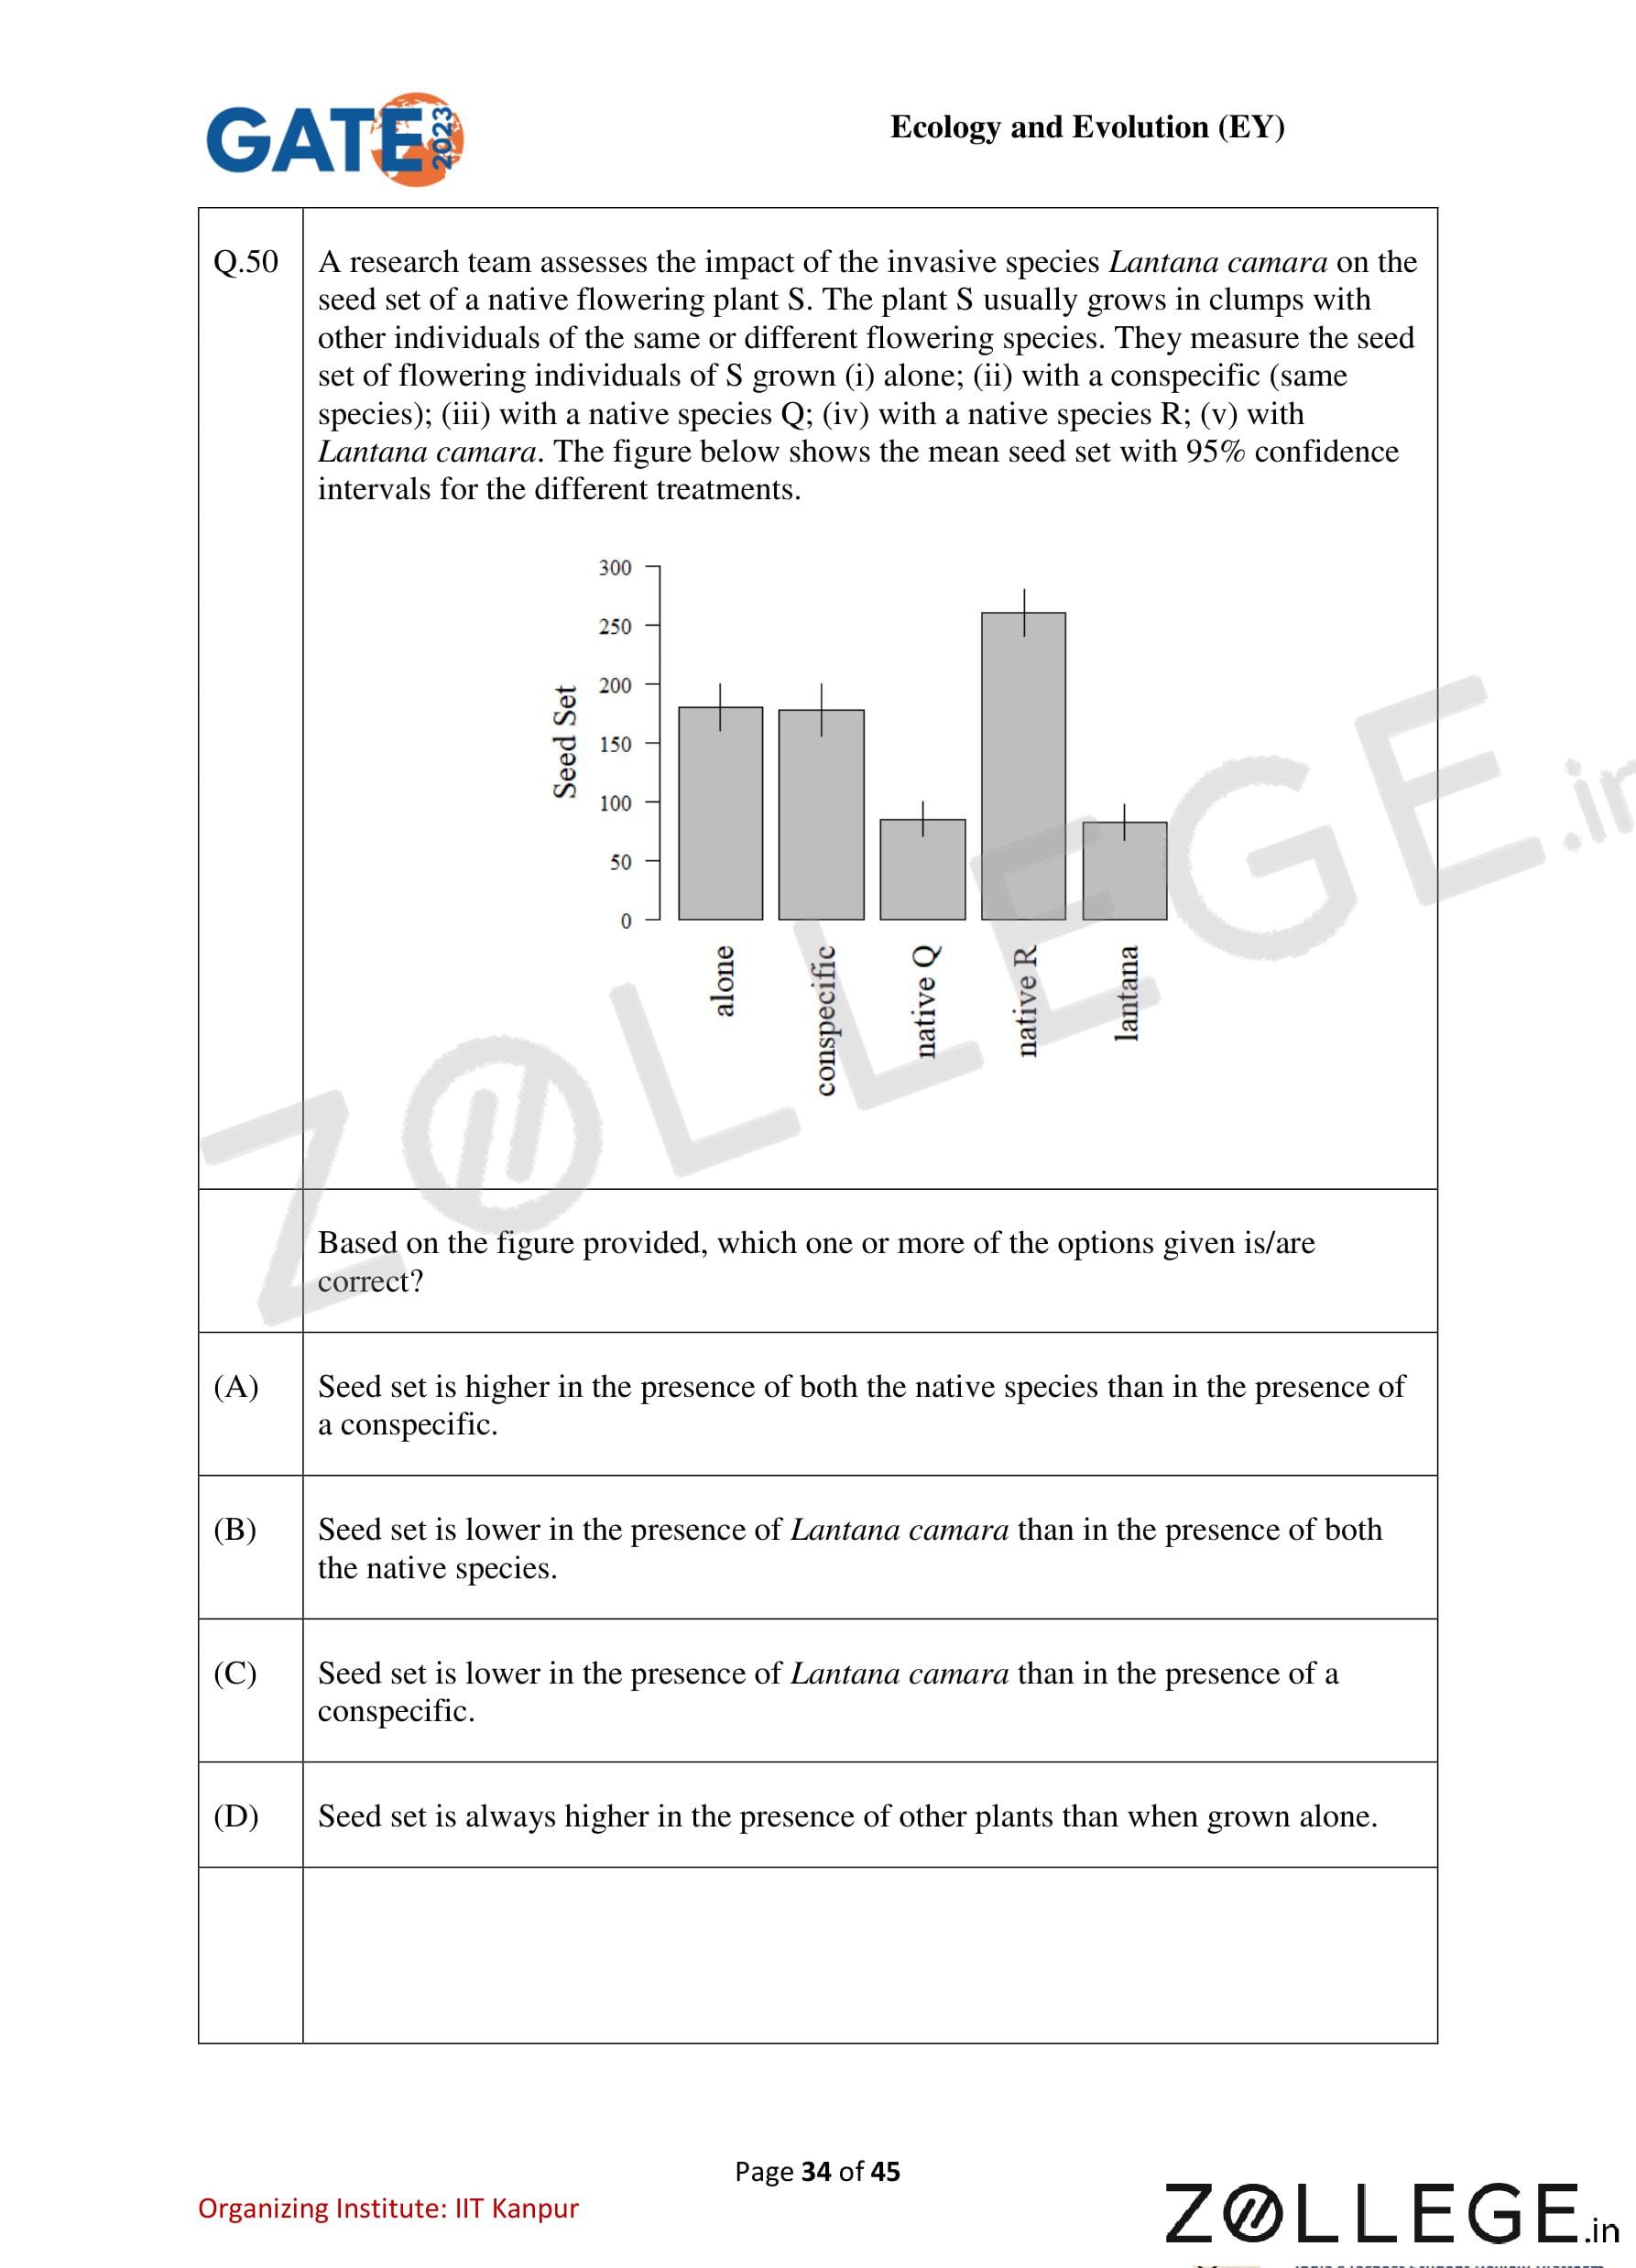
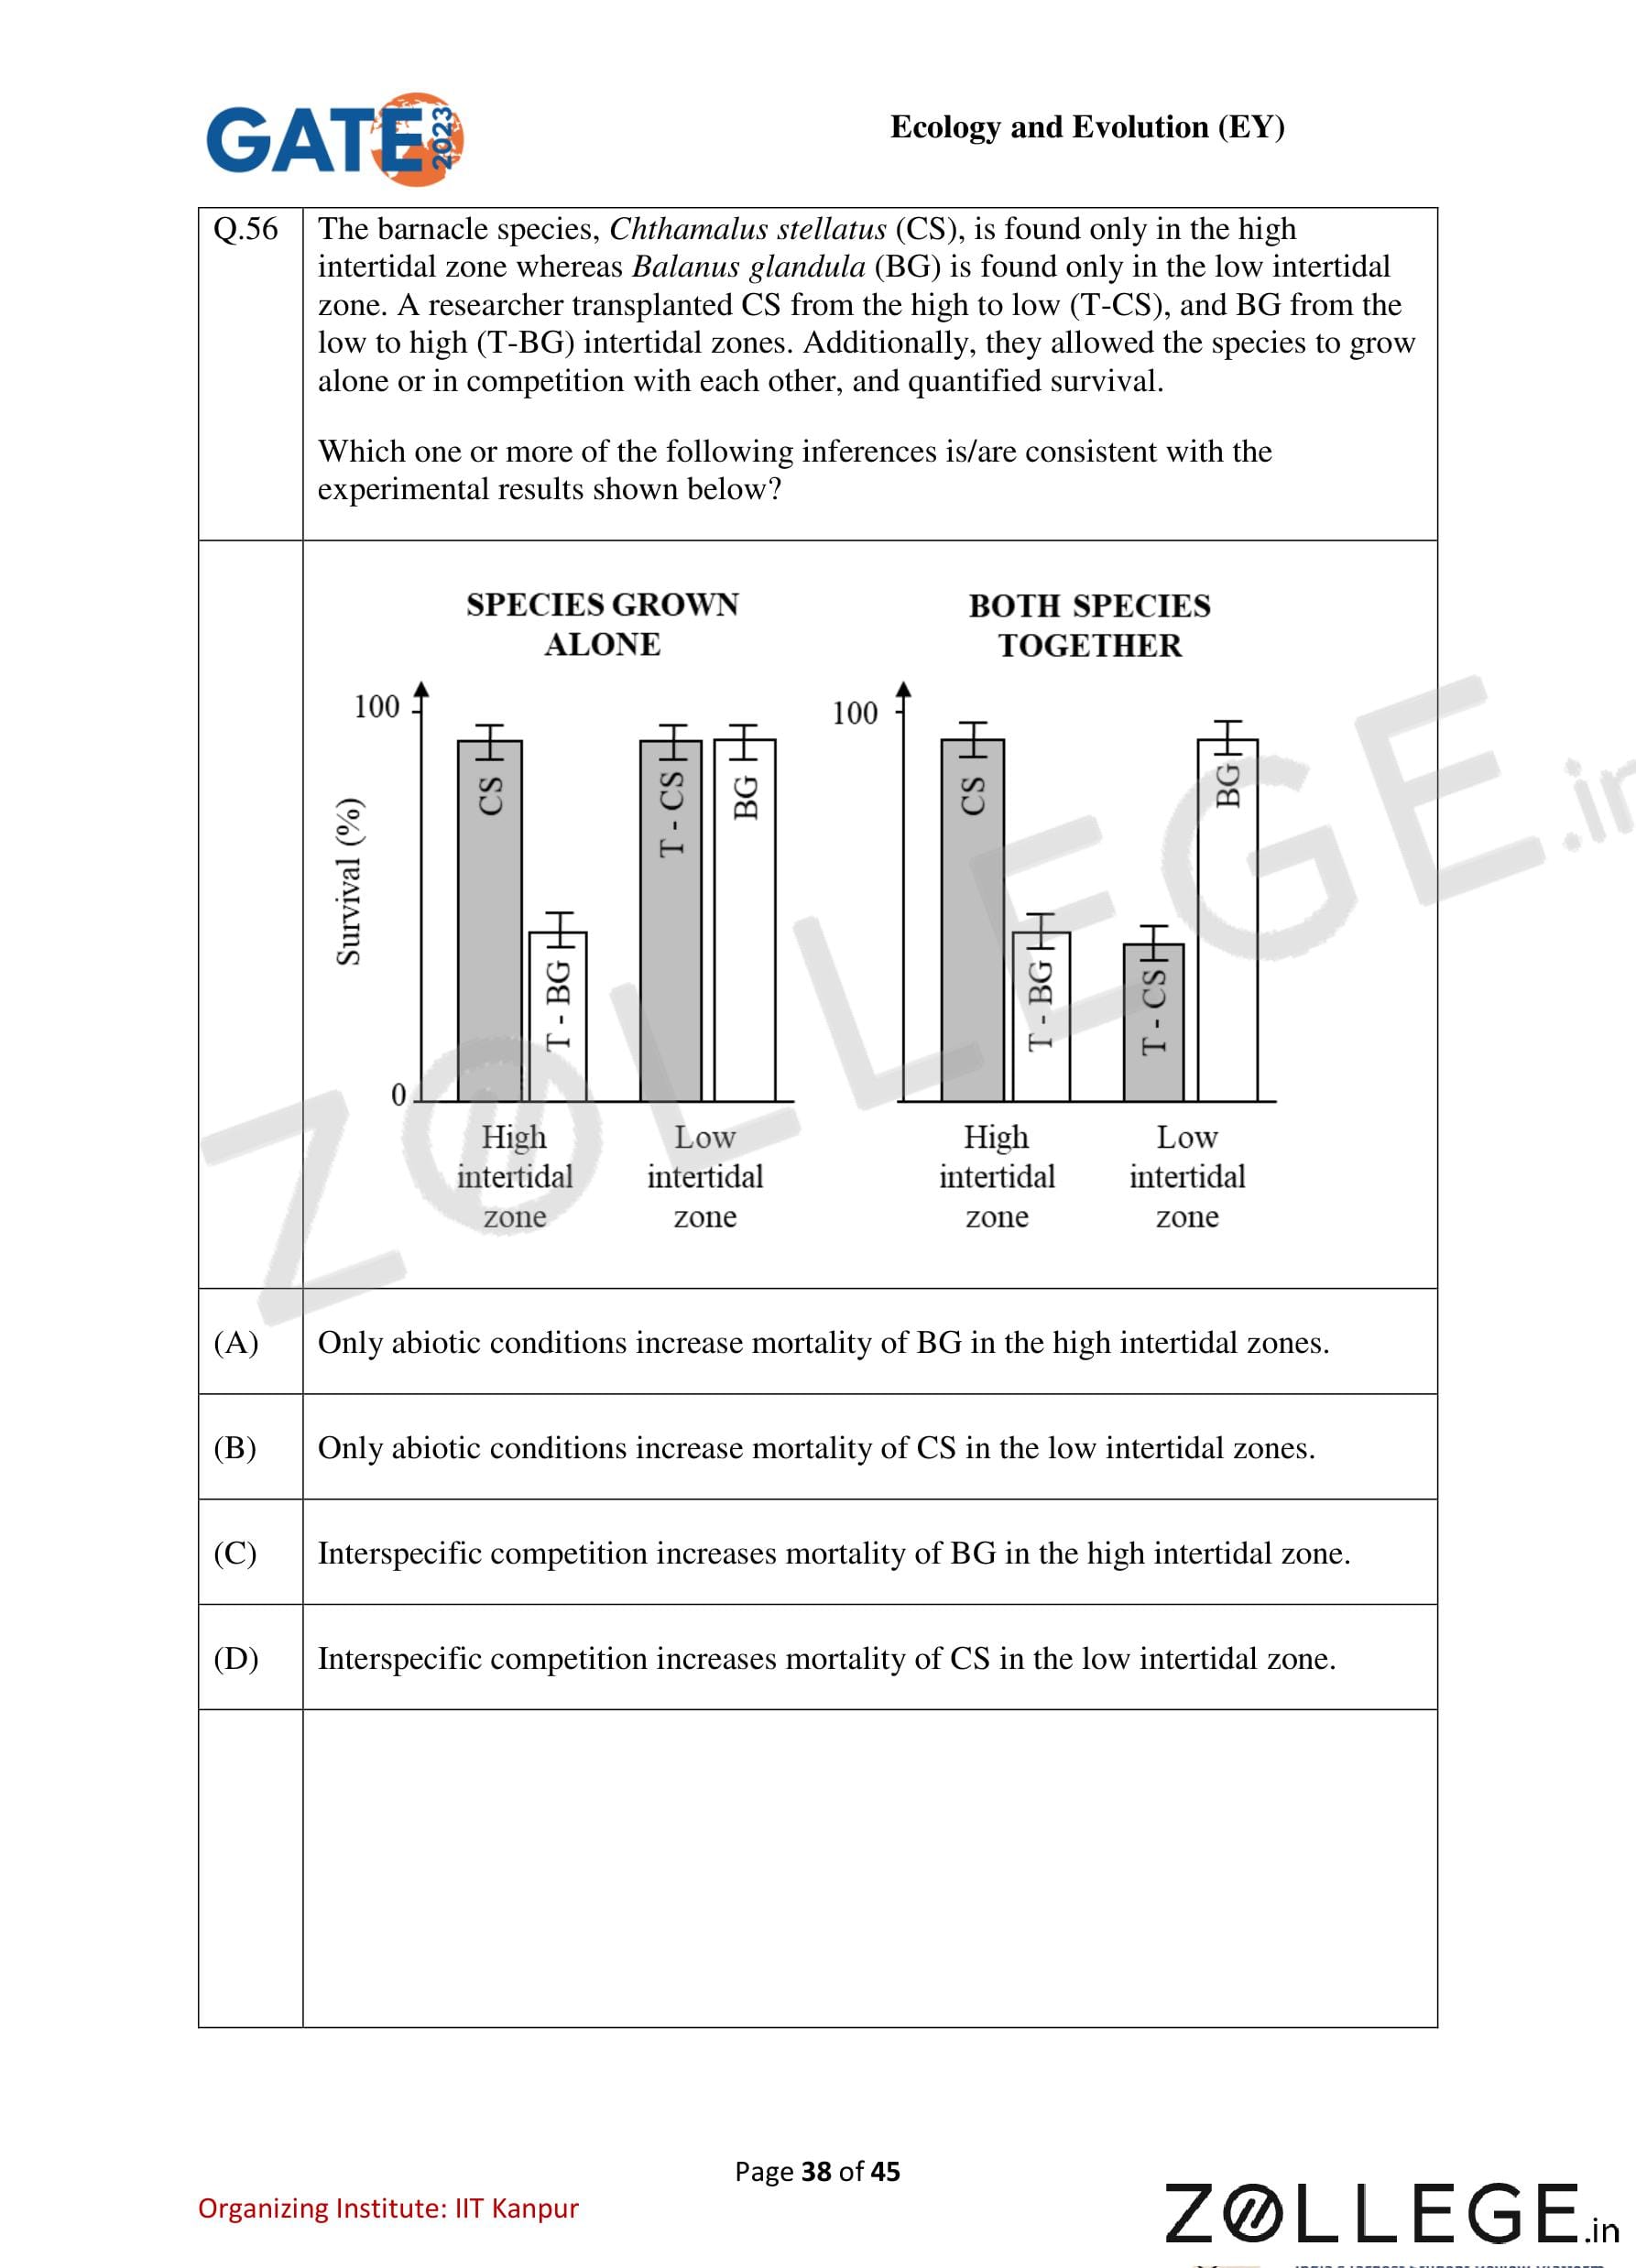
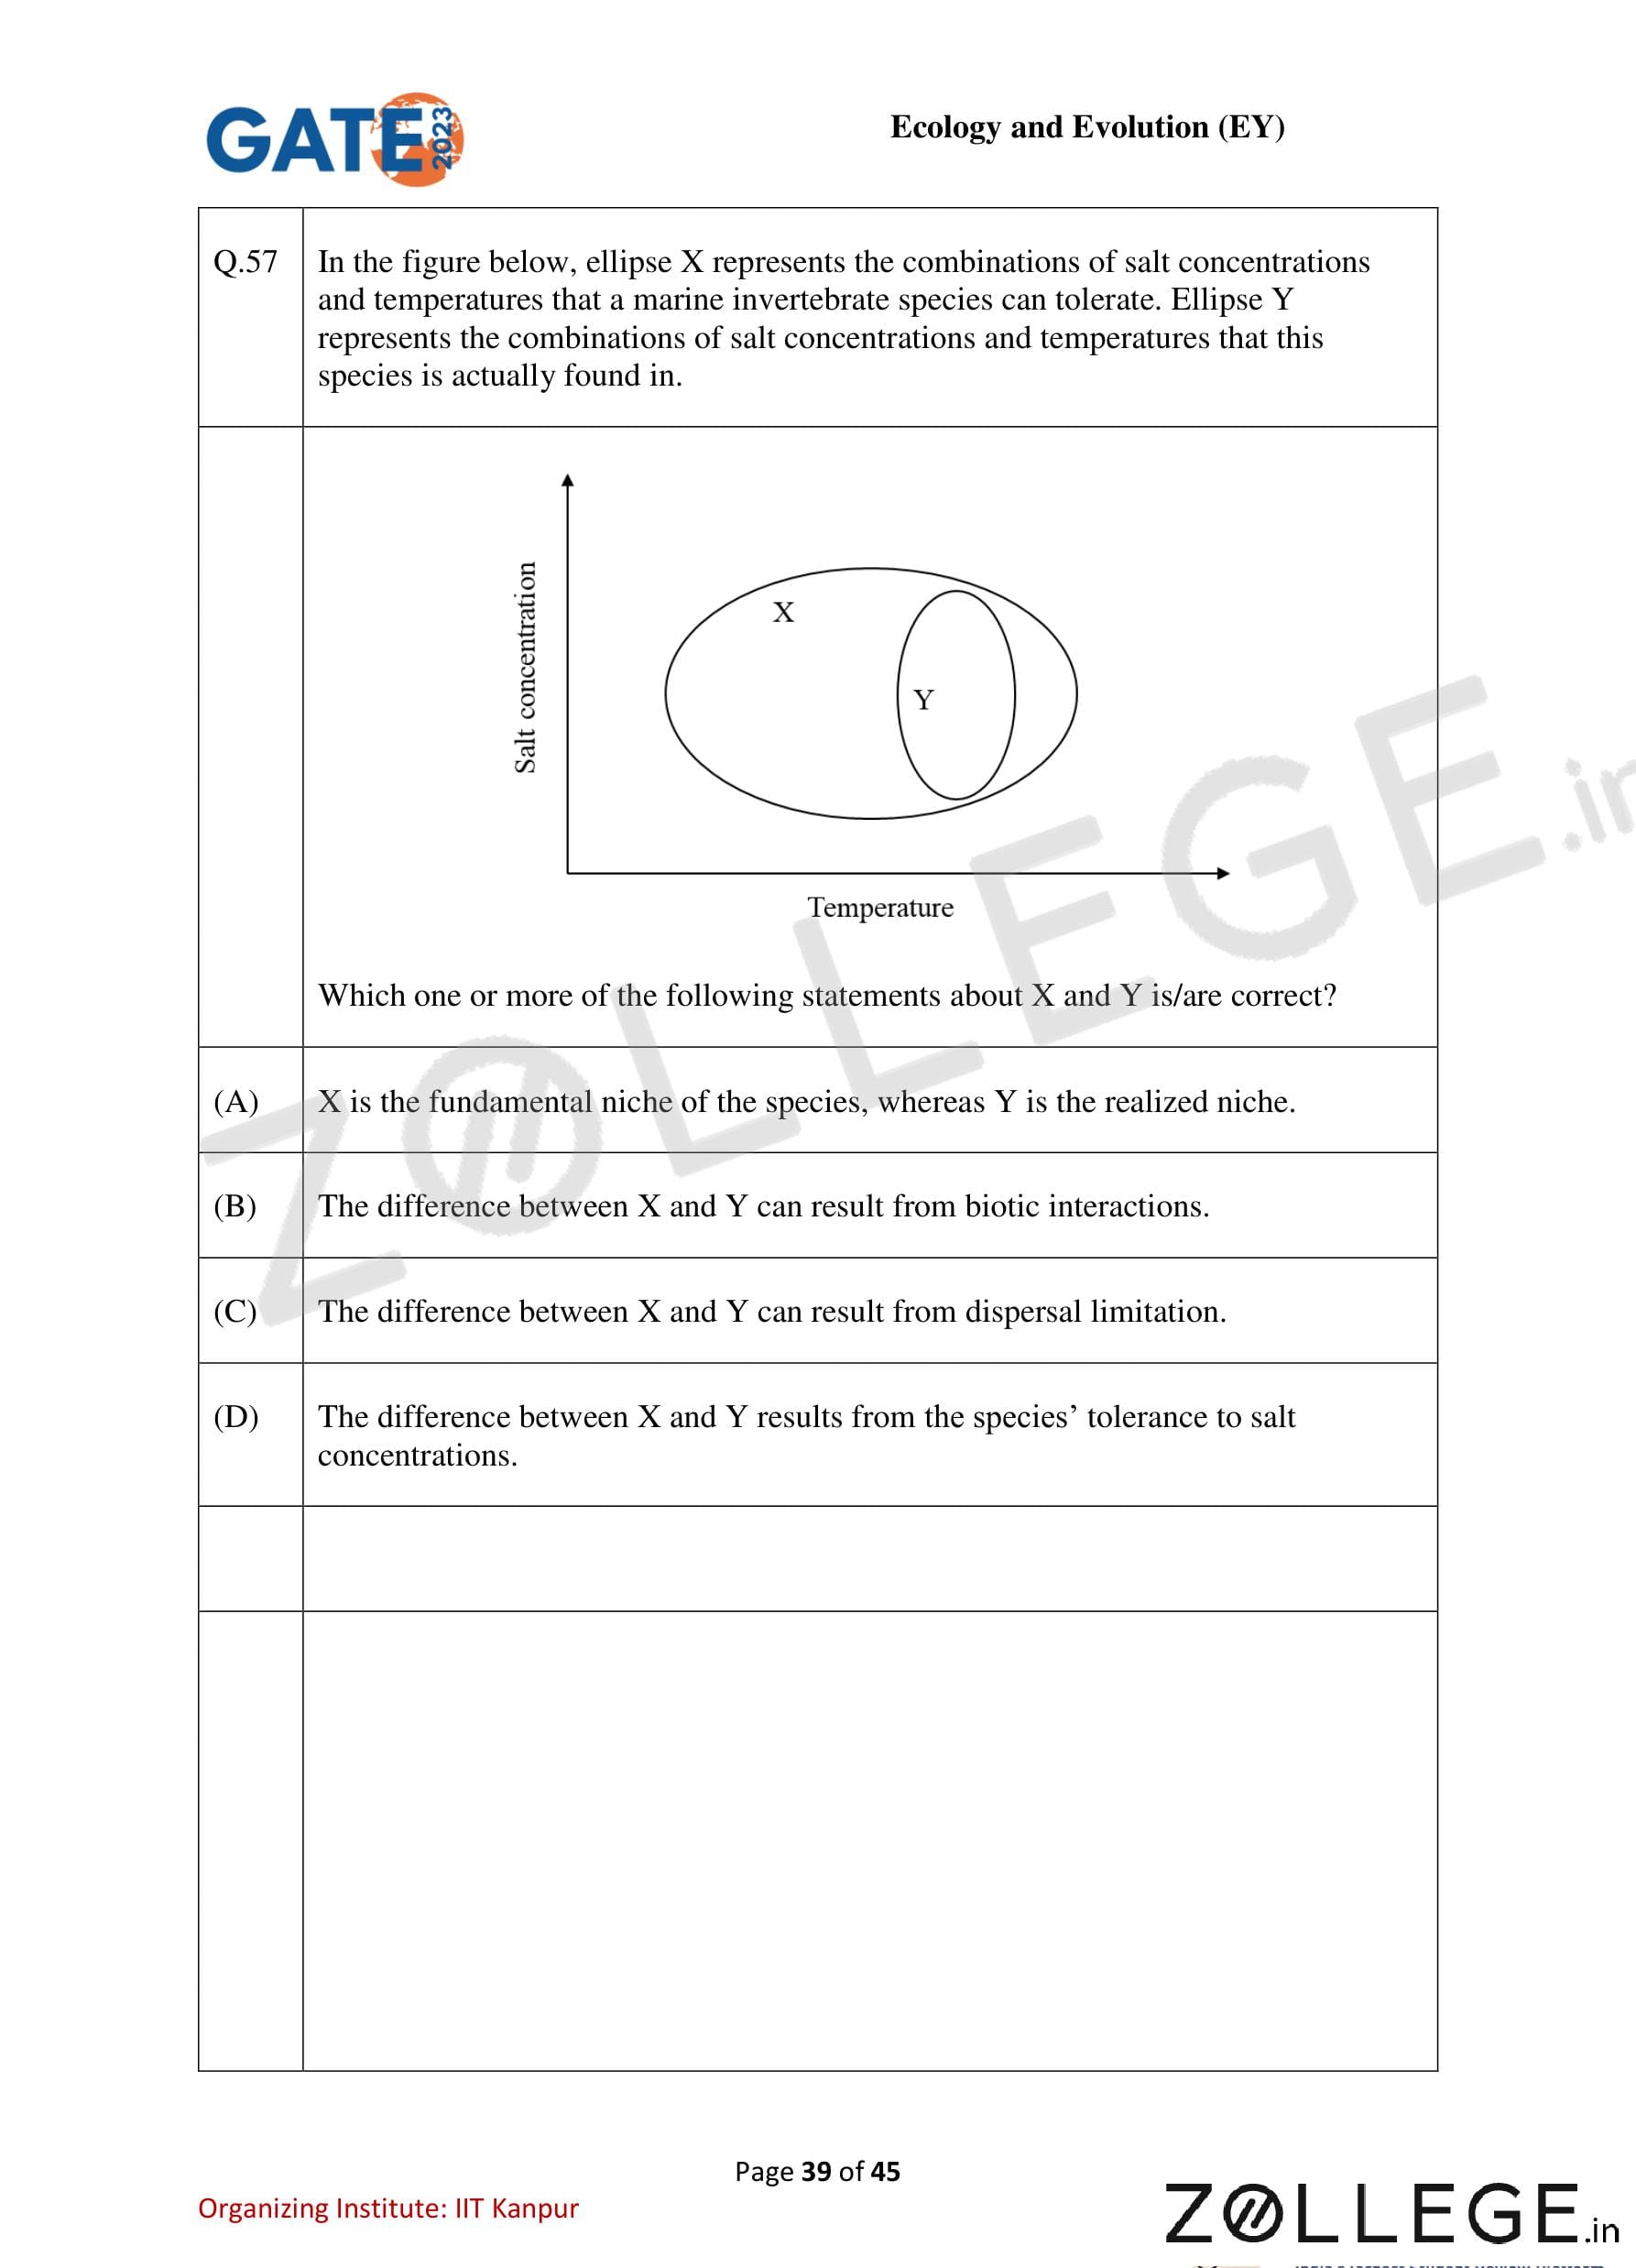
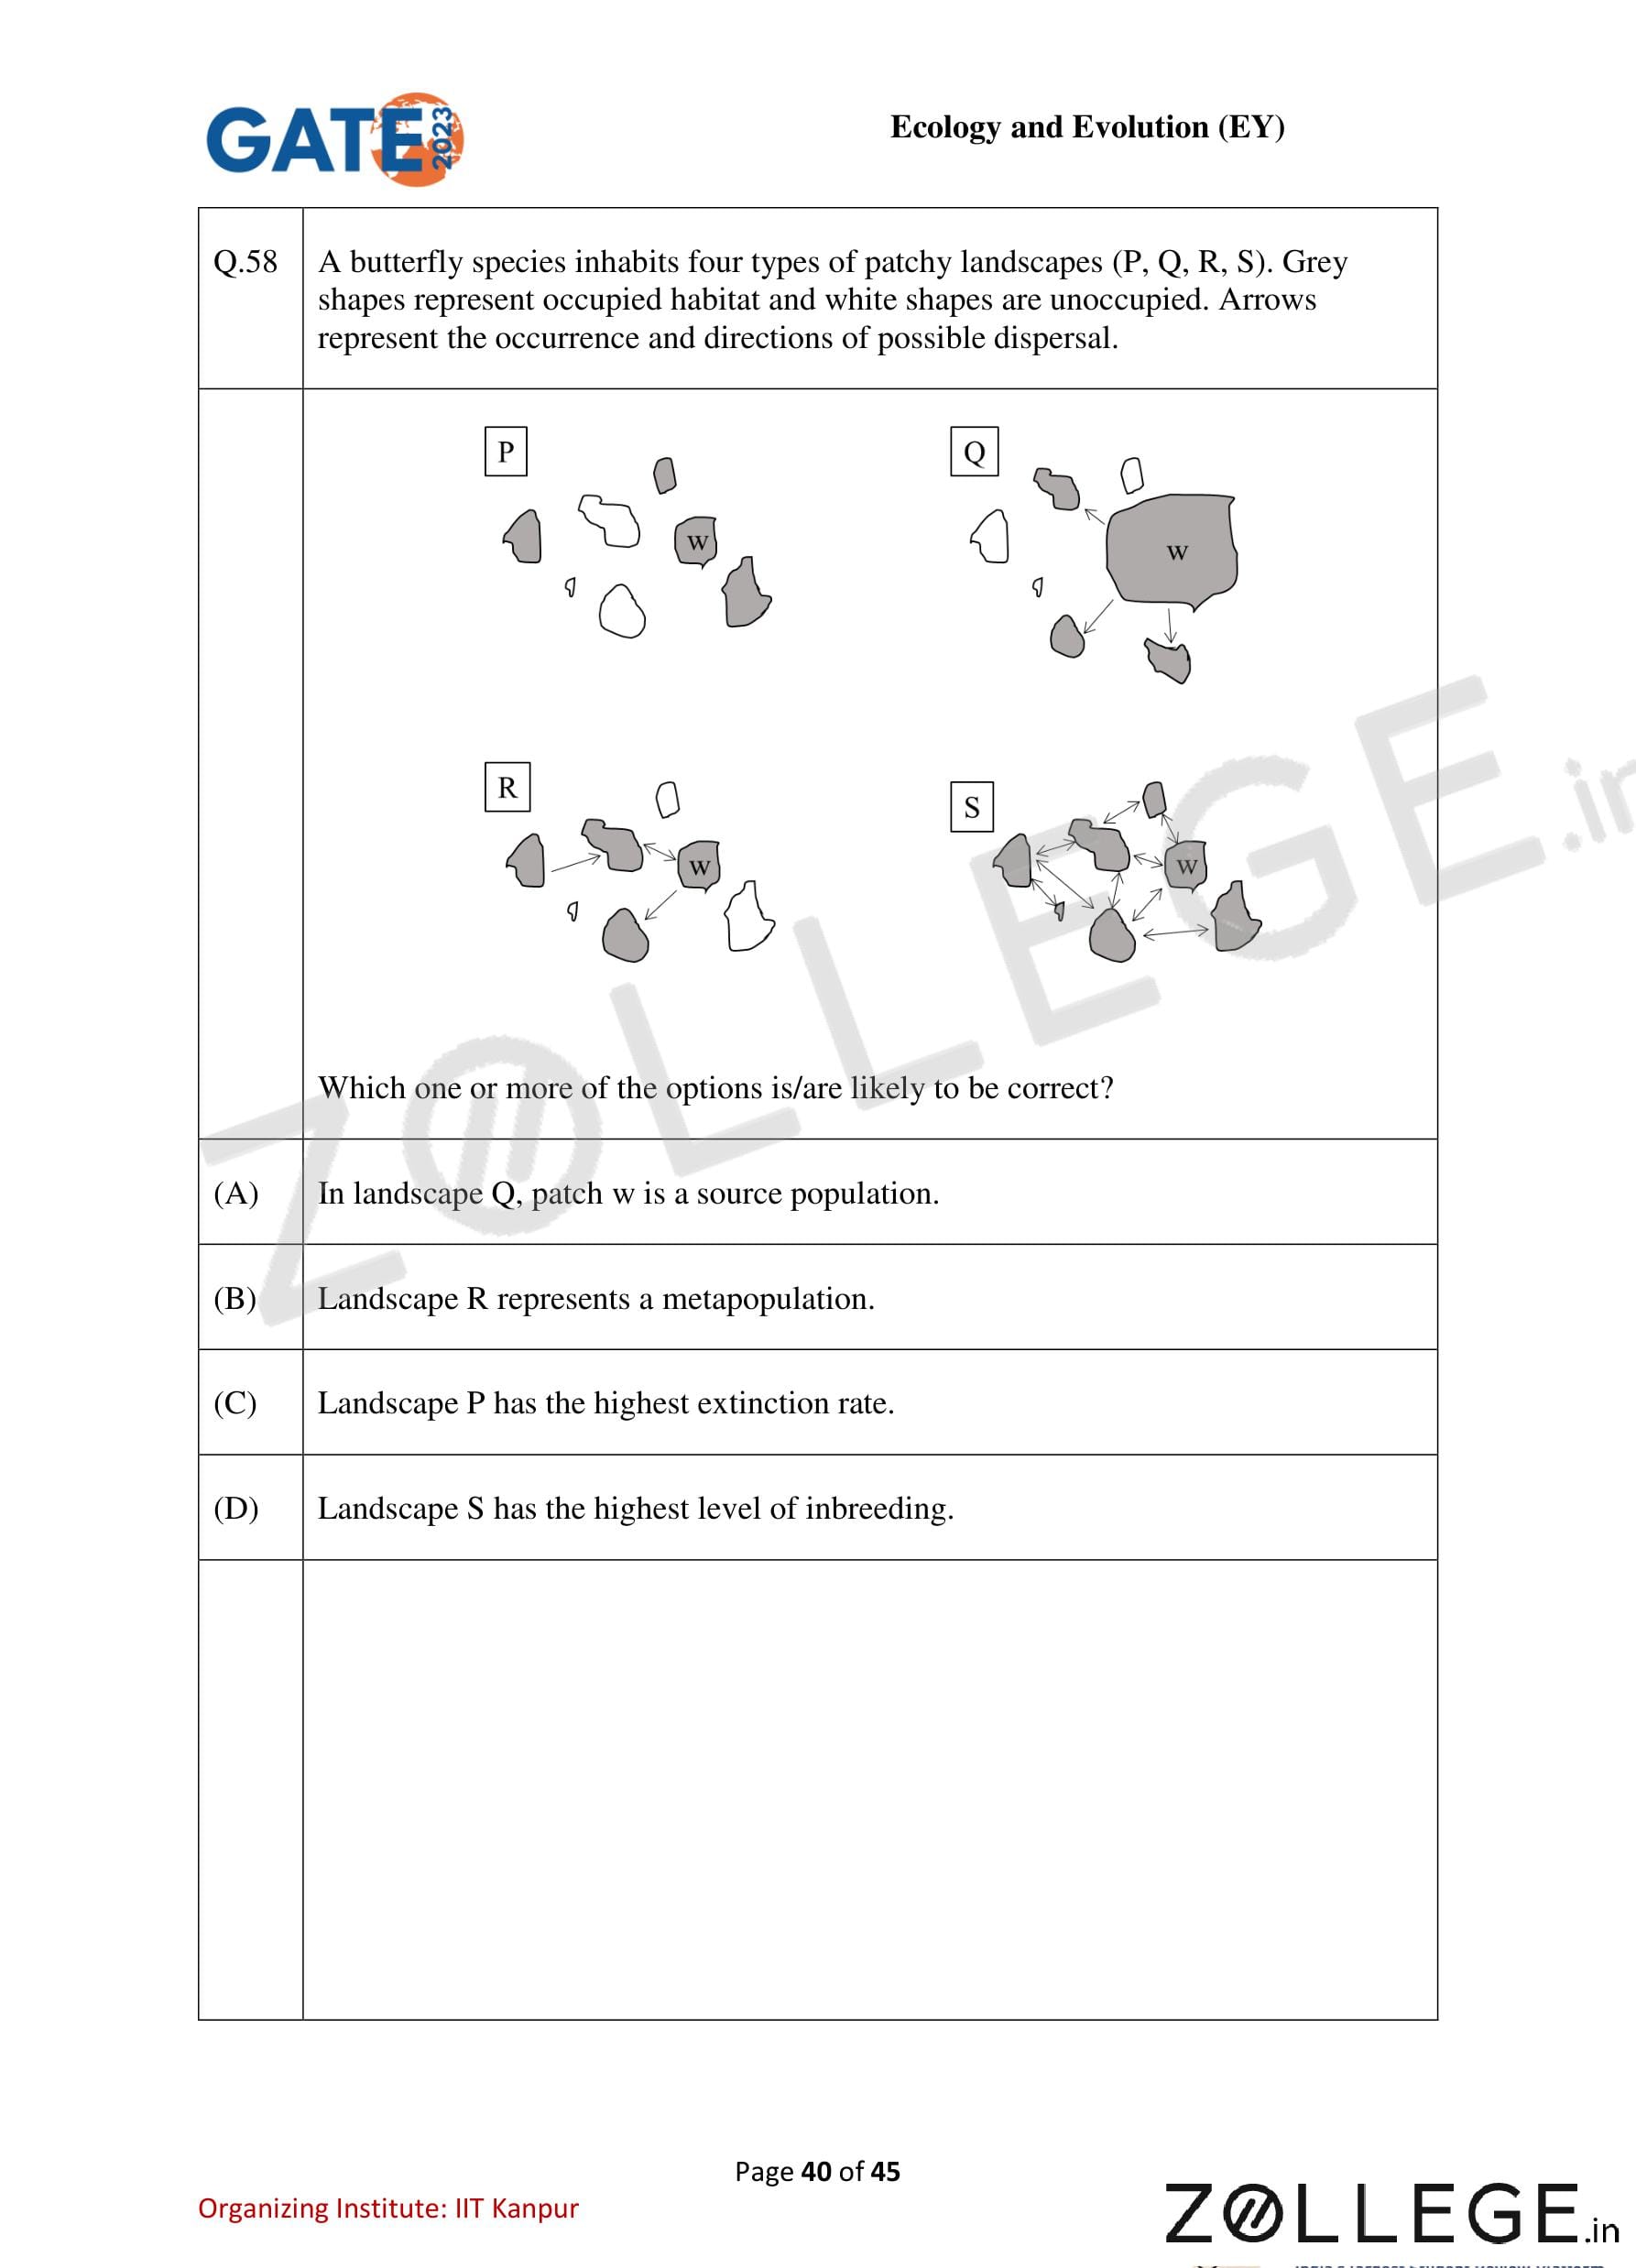

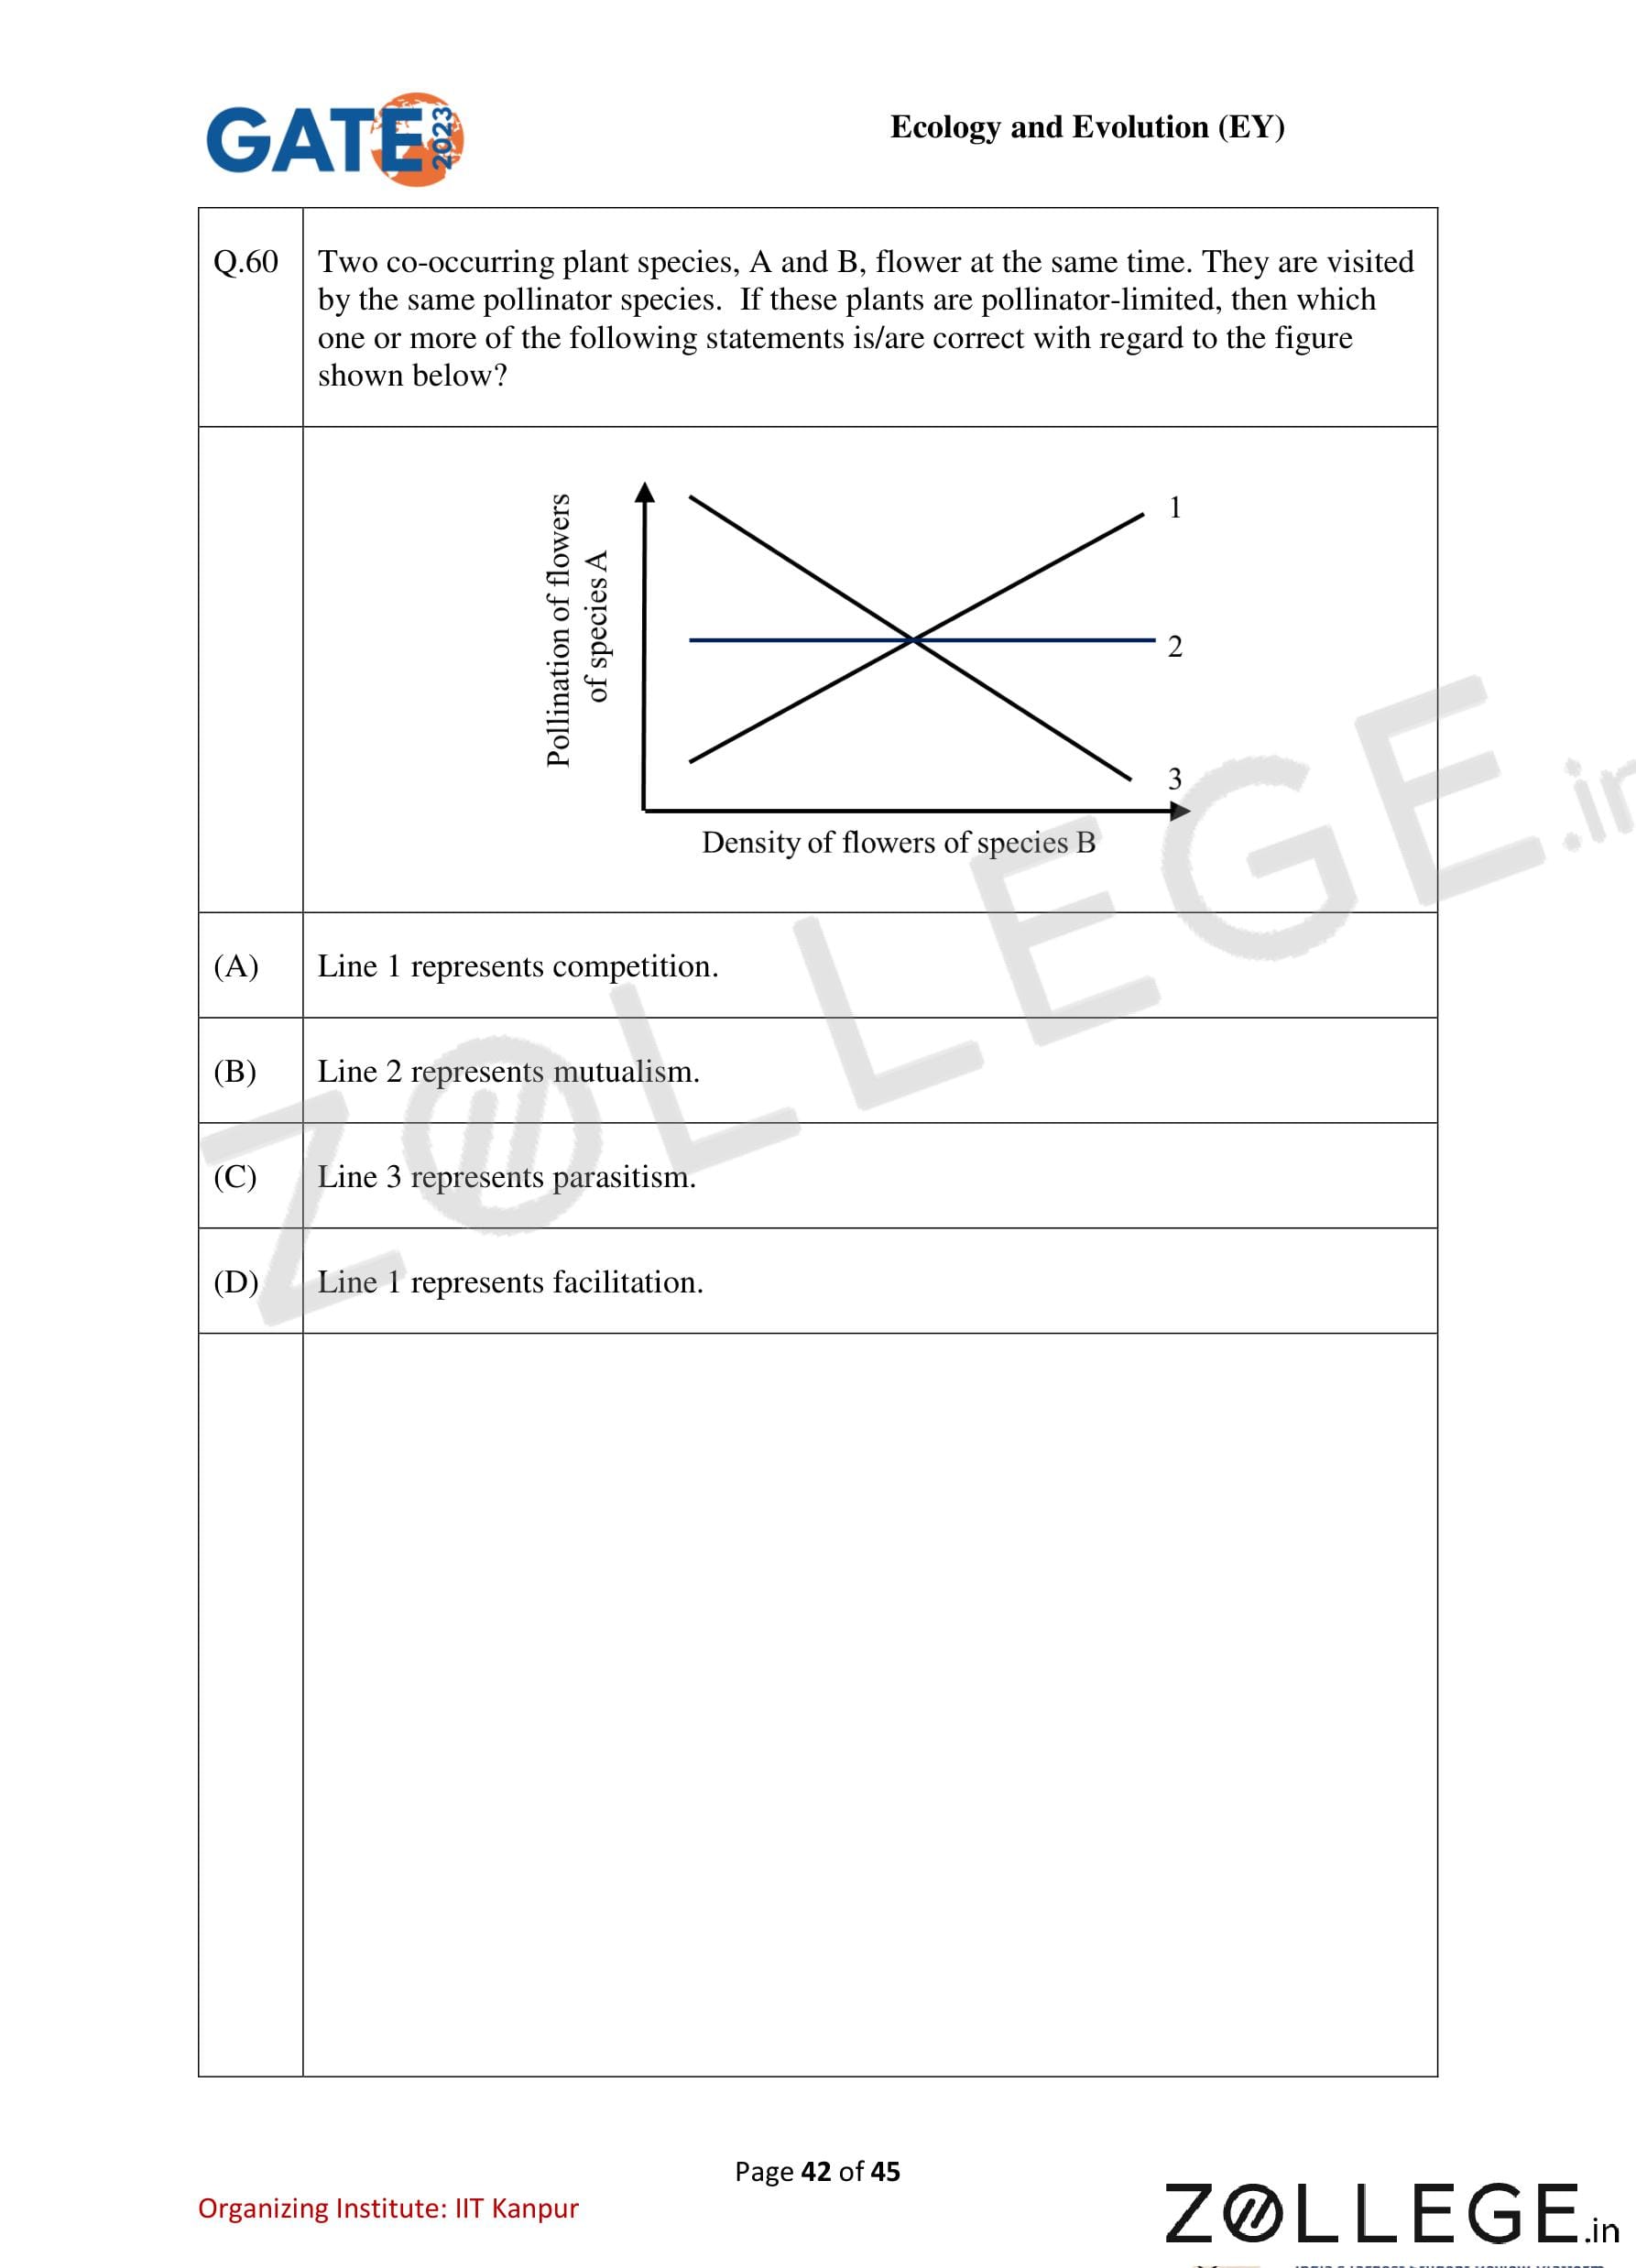
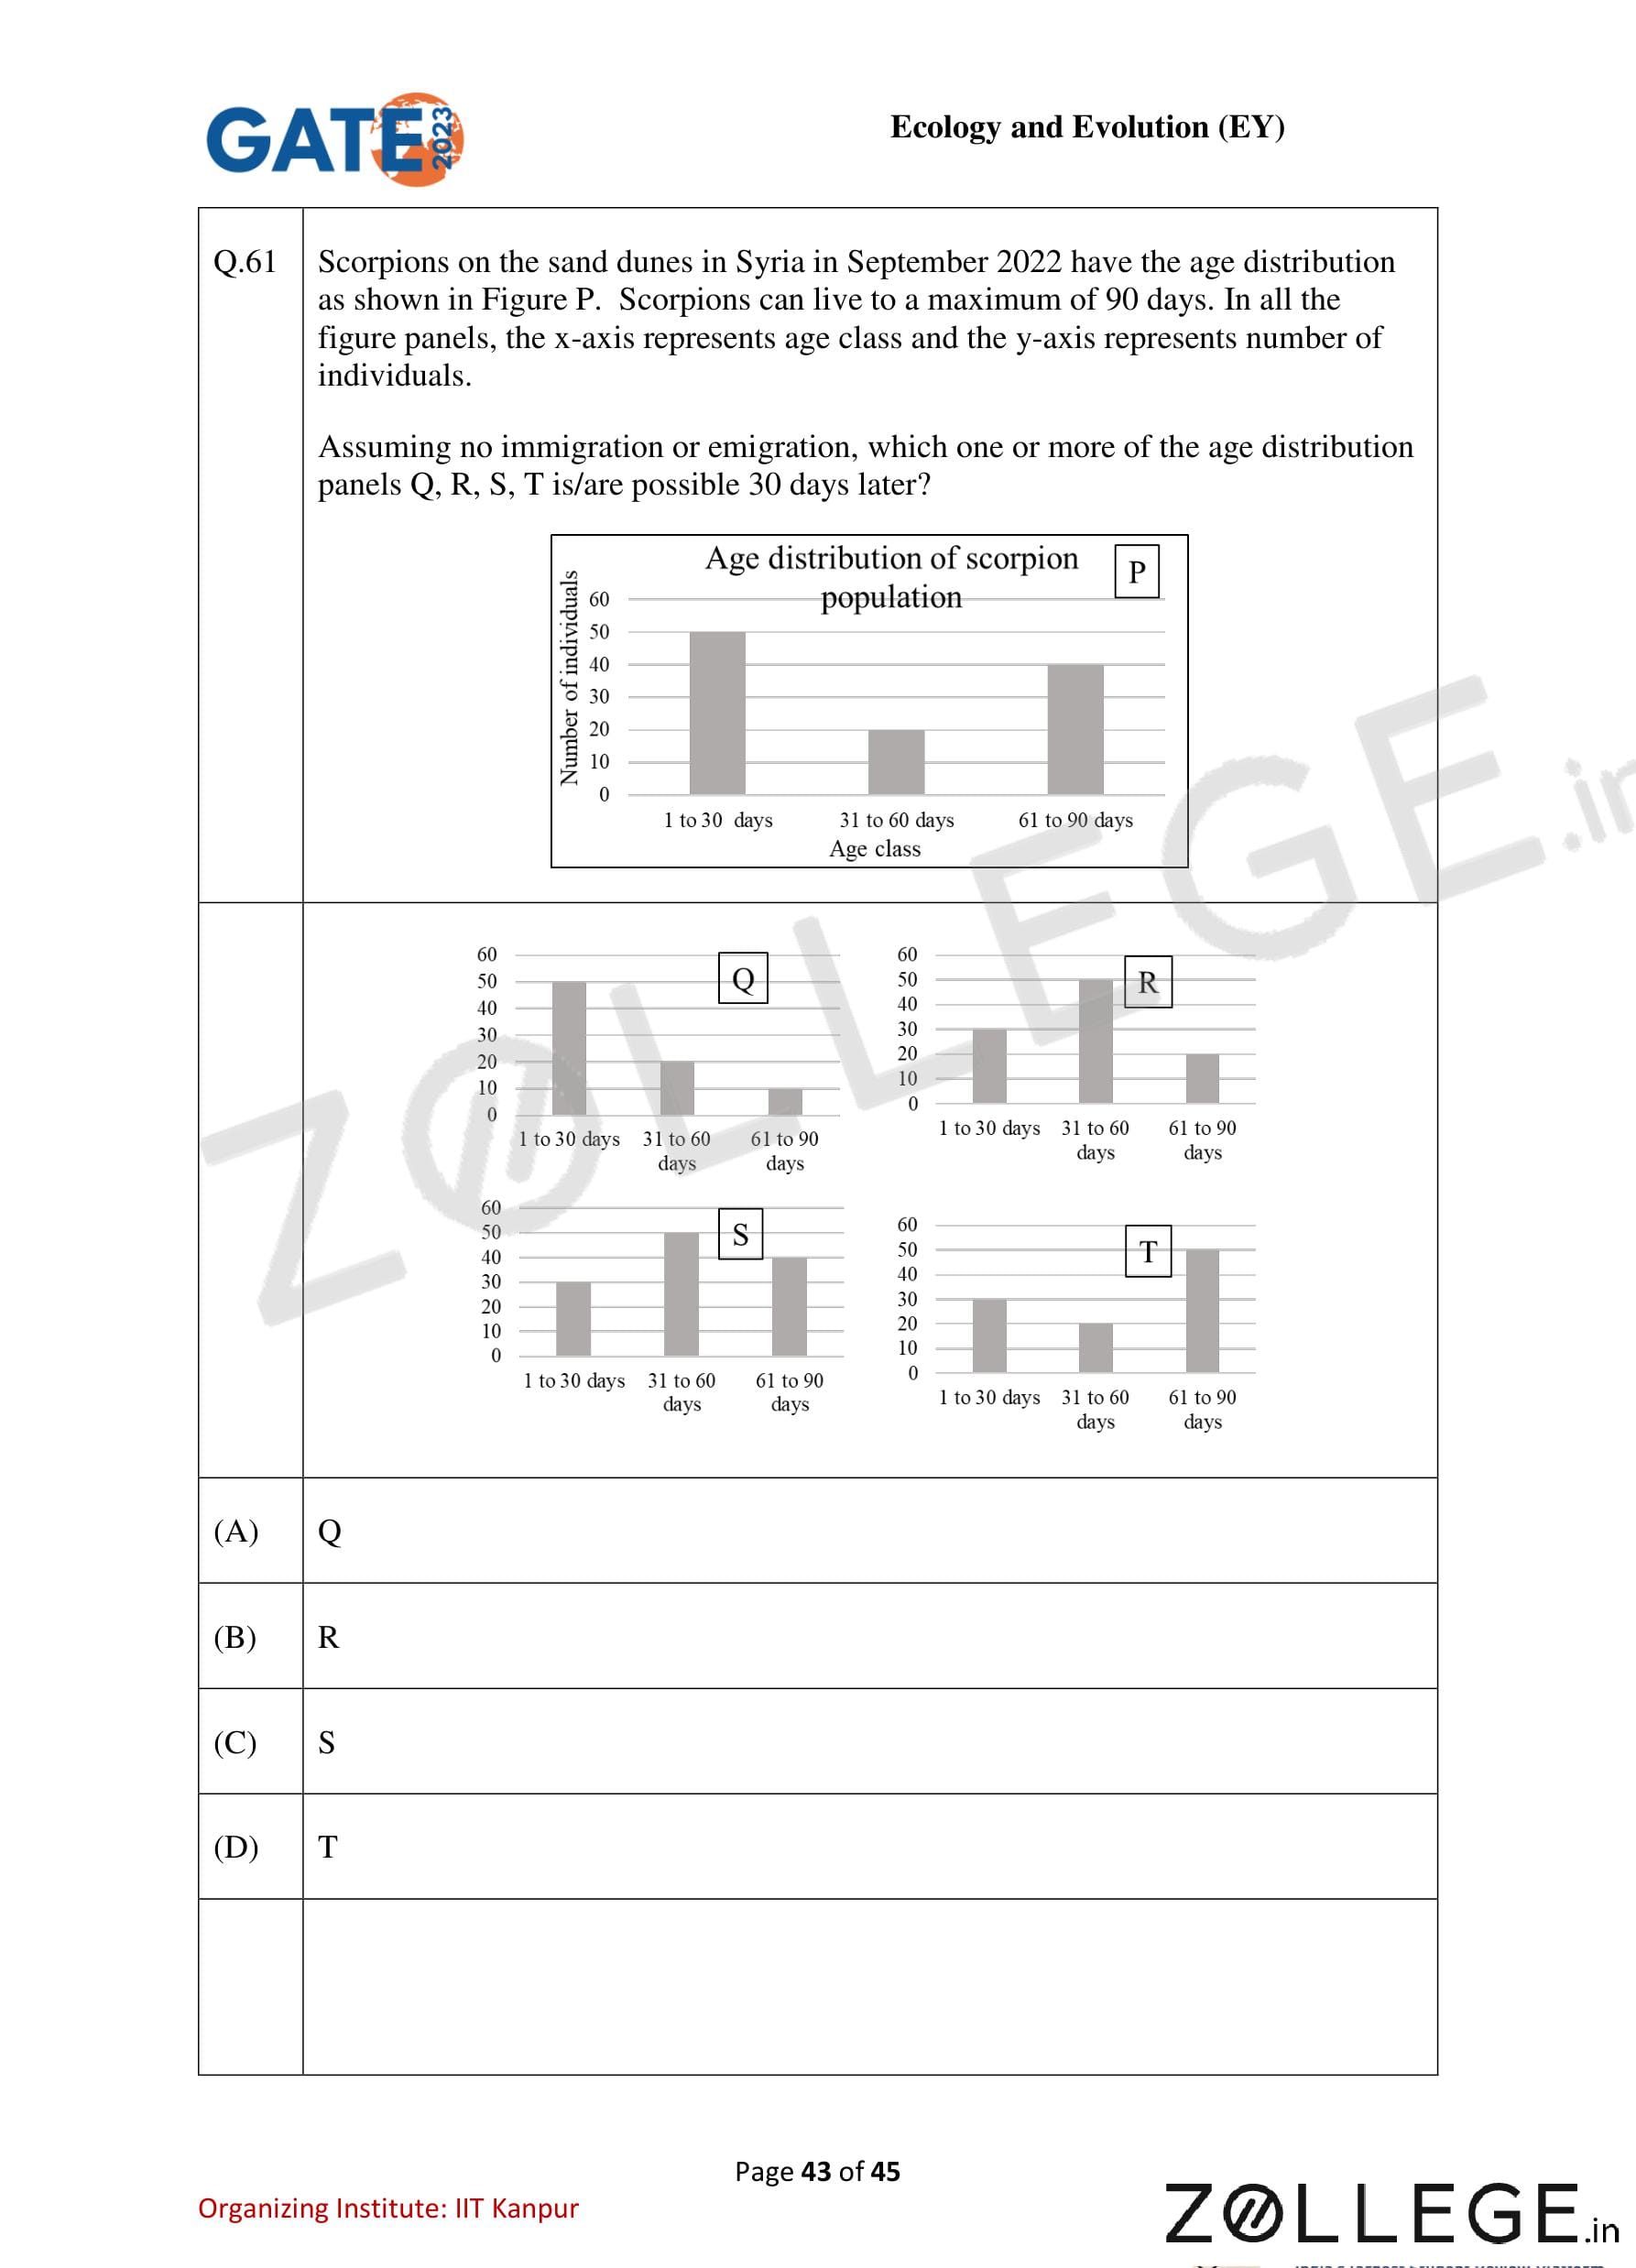
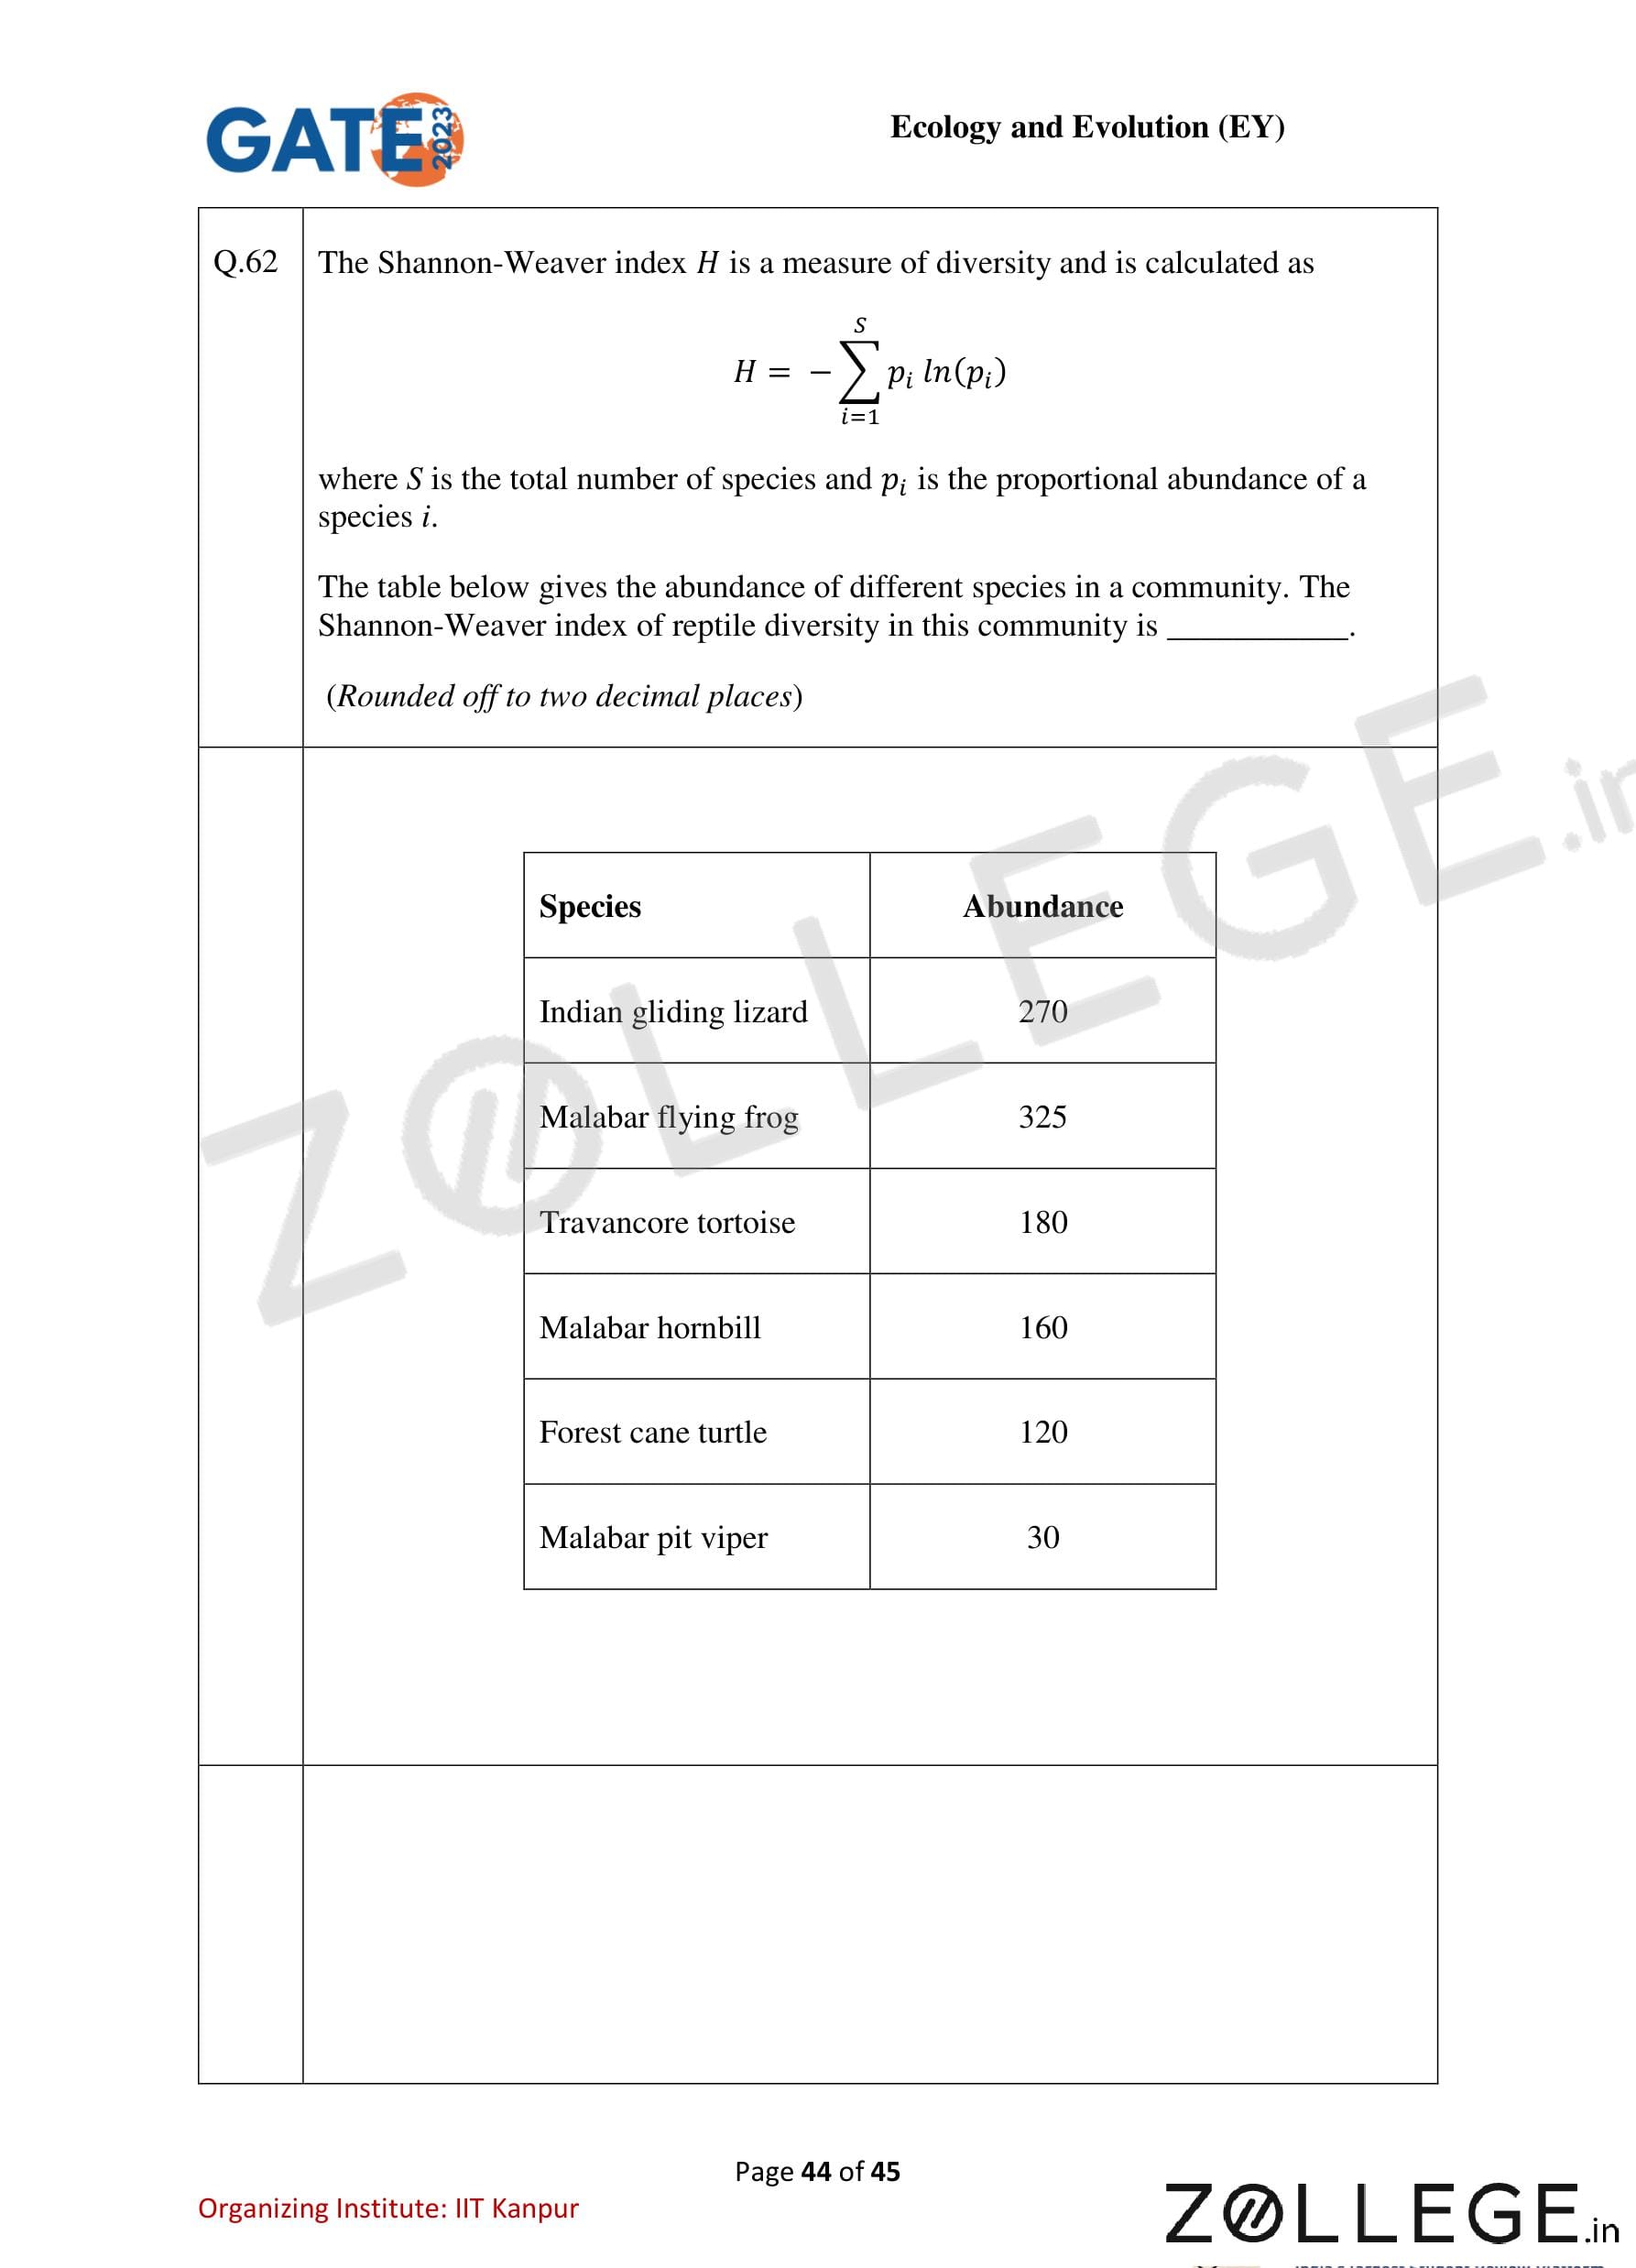
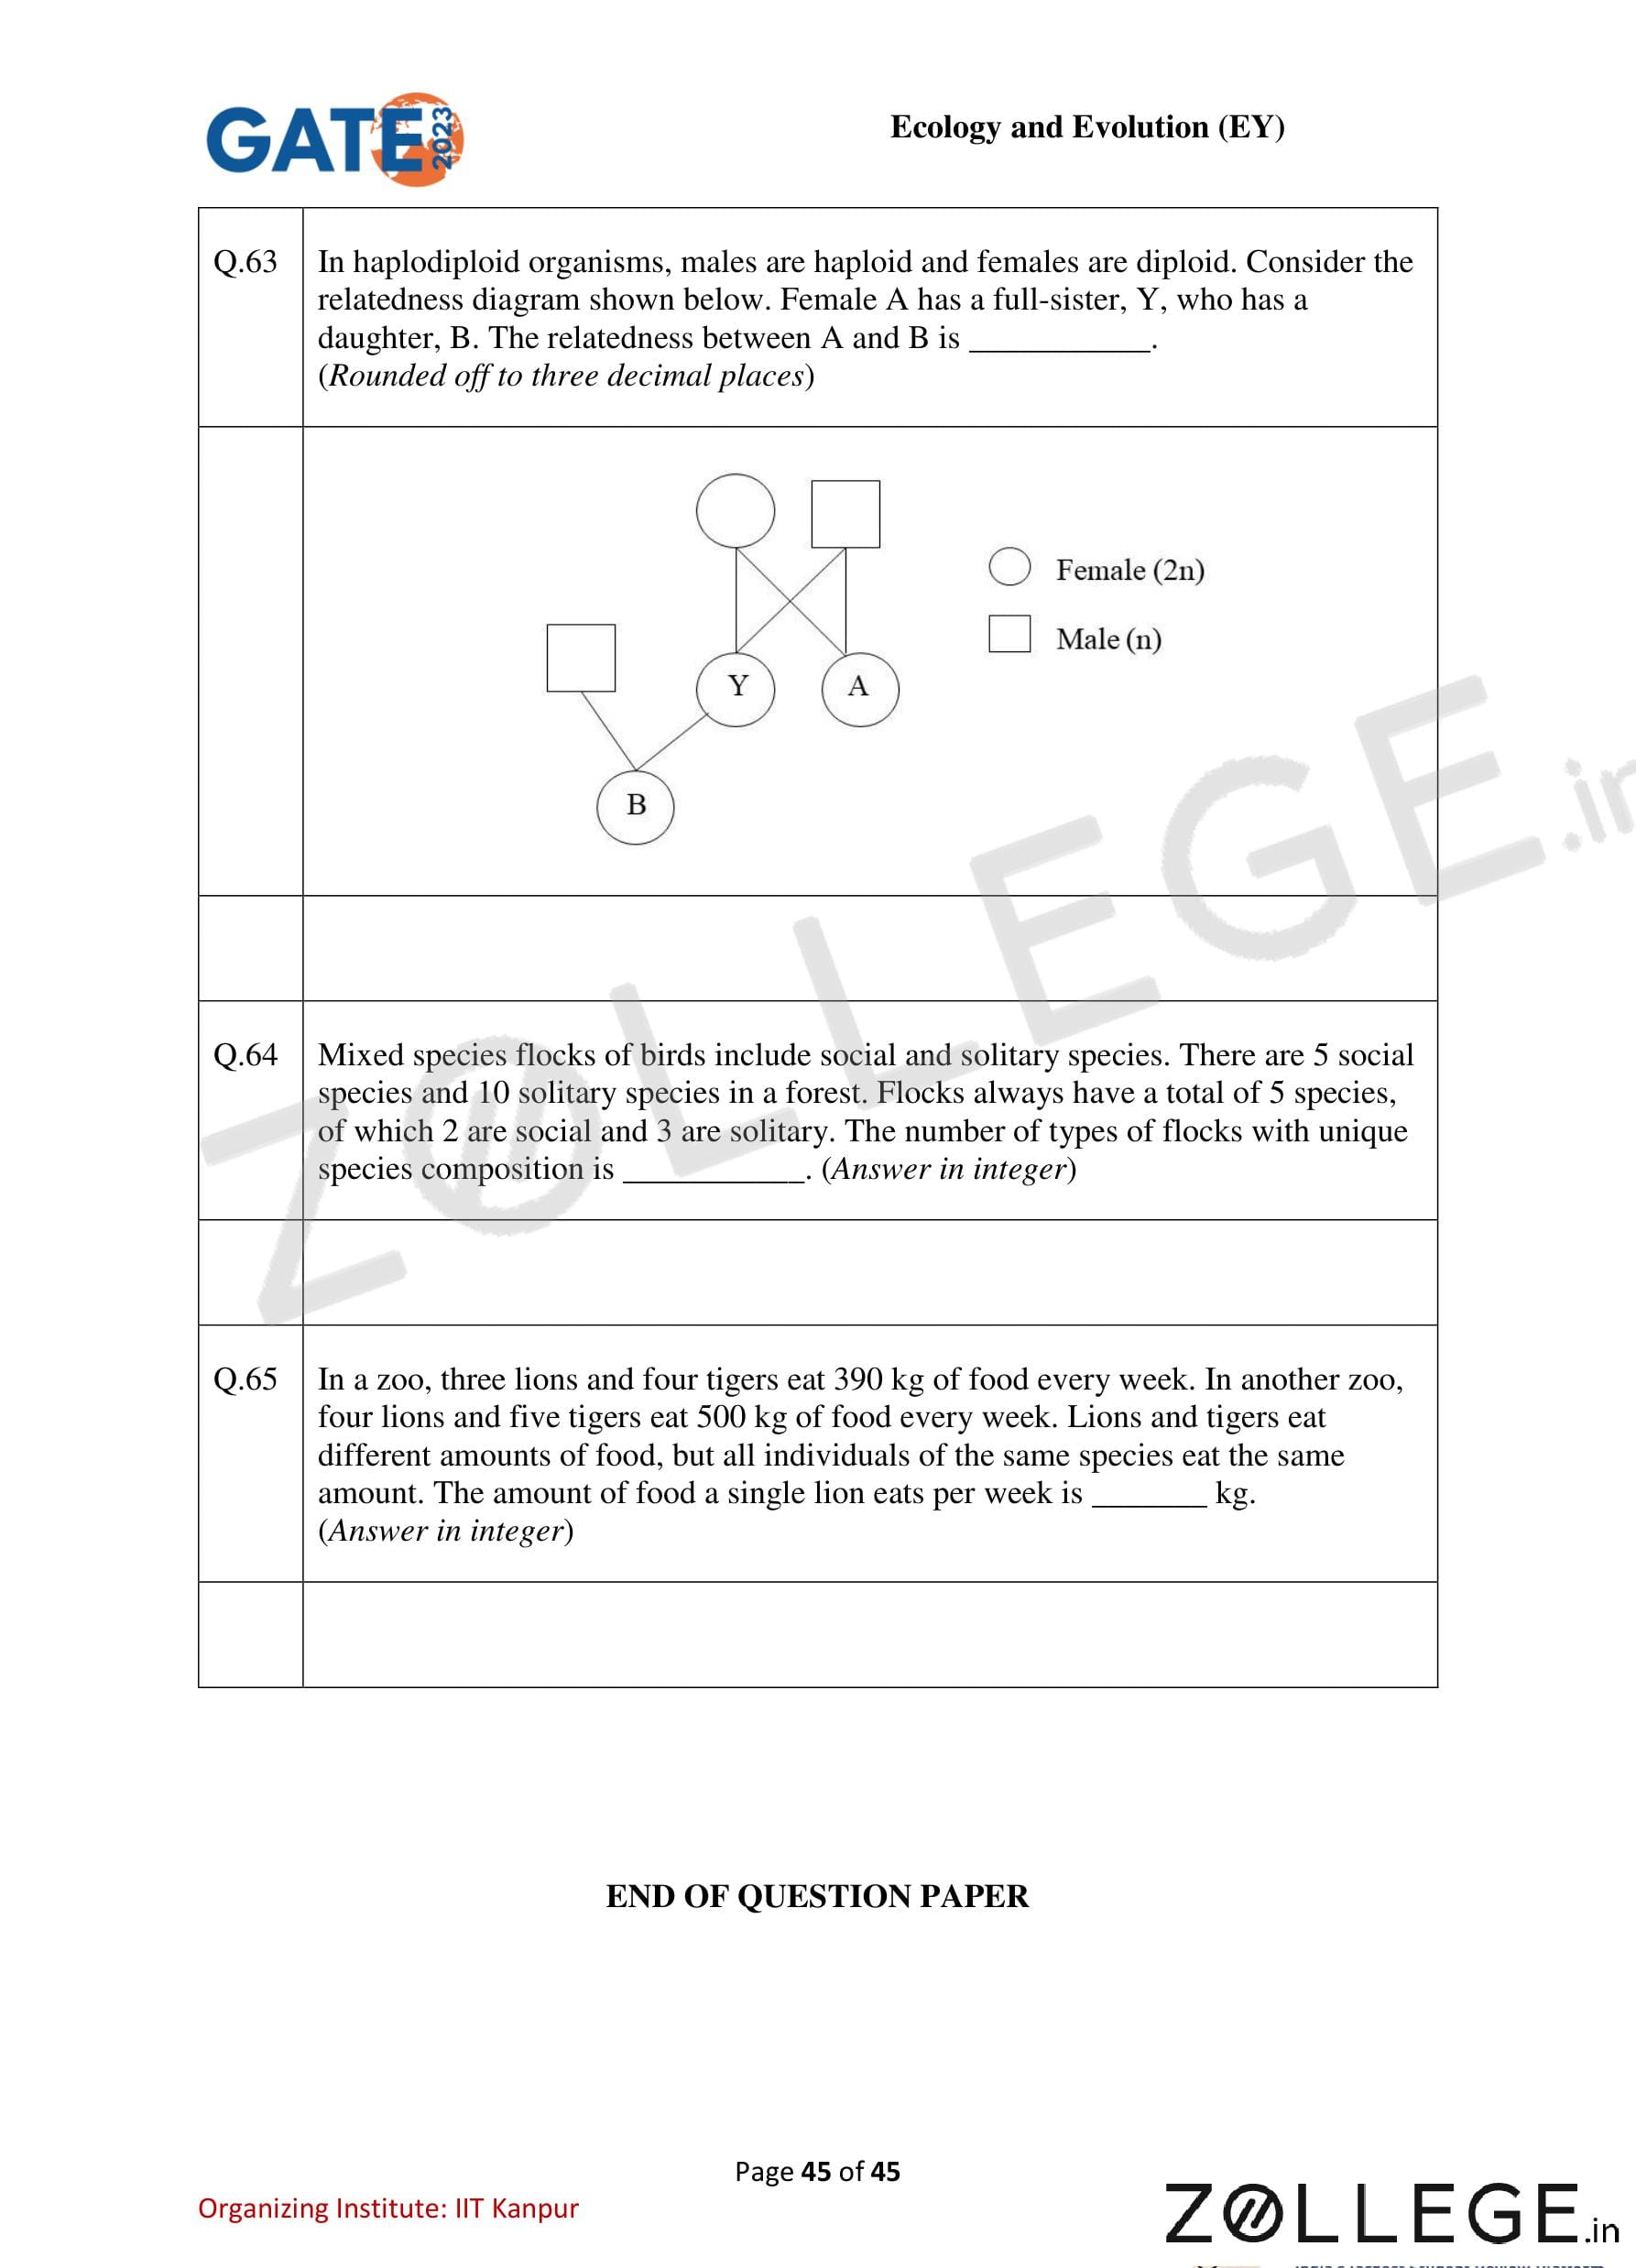
*The article might have information for the previous academic years, please refer the official website of the exam.